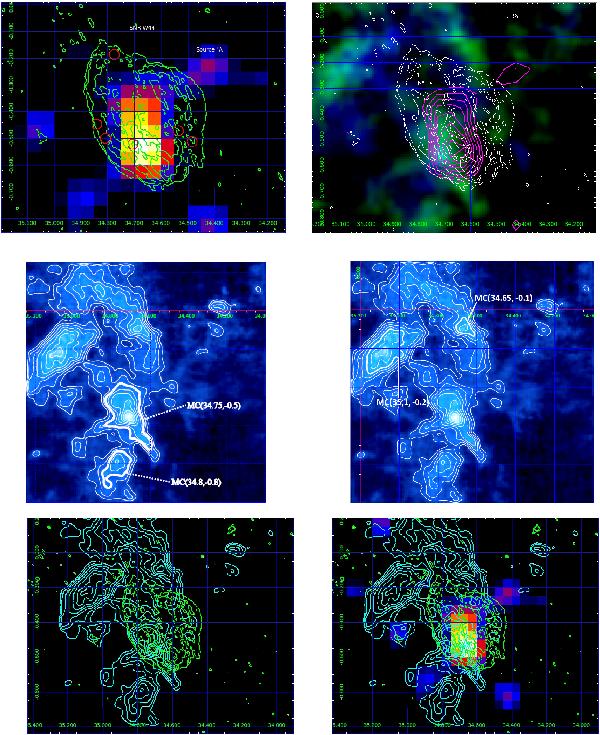
Fig. 2

Upper left panel: AGILE gamma-ray intensity map (in Galactic coordinates) of the W44 region in the energy range 400 MeV–10 GeV, which is obtained by integrating all available data collected during the period from May 2007 to June 2012. The pixel size is 0.05° × 0.05° with a 3-bin Gaussian smoothing. Green contours show the 324 MHz radio continuum flux density detected by the very large array (Castelletti et al. 2007) and red circles indicate detected OH masers (Claussen et al. 1997). Upper right panel: combined CO data from the NANTEN2 observatory that is superimposed with the AGILE gamma-ray data contours (magenta) above 400 MeV of the W44 region (map in Galactic coordinates) and VLA contours (white). The CO data have been selected in the velocity range 40–43 km s-1, corresponding to a kinematic distance compatible with the W44 distance. Middle left and right panels: NANTEN2 CO integrated maps with CO contours (40–43 km s-1). Thick white lines show the four CO peaks. Bottom left panel: NANTEN2 CO integrated contours (40–43 km s-1, cyan) and VLA contours (green). Bottom right panel: AGILE intensity map (400 MeV–10 GeV) with NANTEN2 (cyan) and VLA (green) contours.
Current usage metrics show cumulative count of Article Views (full-text article views including HTML views, PDF and ePub downloads, according to the available data) and Abstracts Views on Vision4Press platform.
Data correspond to usage on the plateform after 2015. The current usage metrics is available 48-96 hours after online publication and is updated daily on week days.
Initial download of the metrics may take a while.


