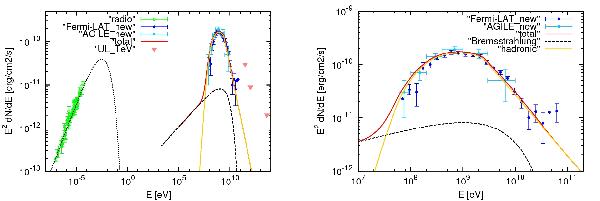
Fig. 4

Our best hadronic model, H3, of the broadband spectrum of the SNR W44 superimposed
with radio (data points in green color) and gamma-ray data of Fig. 1 (in blue and cyan color). Proton distribution in
Eq. (3) with index p1 = 2.2 ±
0.1 (for E < Ebr)
and p2 = 3.2
± 0.1 (for E>Ebr)
where  GeV. This model is
characterized by B = 210
μG and n = 300
cm-3. The
yellow curve shows the neutral pion emission from the accelerated proton
distribution discussed in the text. The black curves show the electron contribution
by synchrotron (dot) and bremsstrahlung (dashed) emissions; the IC contribution is
negligible. The red curve shows the total gamma-ray emission from pion-decay and
bremsstrahlung. Left panel: SED from radio to gamma-ray band.
Right panel: only gamma-ray part of the spectrum.
Current usage metrics show cumulative count of Article Views (full-text article views including HTML views, PDF and ePub downloads, according to the available data) and Abstracts Views on Vision4Press platform.
Data correspond to usage on the plateform after 2015. The current usage metrics is available 48-96 hours after online publication and is updated daily on week days.
Initial download of the metrics may take a while.


