| Issue |
A&A
Volume 559, November 2013
|
|
|---|---|---|
| Article Number | A24 | |
| Number of page(s) | 20 | |
| Section | Interstellar and circumstellar matter | |
| DOI | https://doi.org/10.1051/0004-6361/201220621 | |
| Published online | 30 October 2013 | |
Uncertainties in water chemistry in disks: An application to TW Hydrae⋆,⋆⋆
1
Kapteyn Astronomical Institute, Postbus 800, 9700 AV
Groningen, The
Netherlands
e-mail: This email address is being protected from spambots. You need JavaScript enabled to view it.
2
Université Joseph Fourier Grenoble-1, CNRS-INSU, Institut de
Planétologie et d’Astrophysique (IPAG) UMR 5274, 38041
Grenoble,
France
3
Universidad Autonoma de Madrid, Dpt. Fisica Teorica,
Campus Cantoblanco,
28049
Madrid,
Spain
4
SUPA, School of Physics & Astronomy, University of St.
Andrews, North
Haugh, St. Andrews,
KY16 9SS,
UK
5
Lunar and Planetary Laboratory, 1629 E. University Blvd., Tucson
AZ
85271-0092,
USA
6
ALMA SCO, Alonso de Cordova 3107, Vitacura,
Santiago,
Chile
Received:
24
October
2012
Accepted:
2
August
2013
Abstract
Context. This paper discusses the sensitivity of water lines to chemical processes and radiative transfer for the protoplanetary disk around TW Hya. The study focuses on the Herschel spectral range in the context of new line detections with the PACS instrument from the Gas in Protoplanetary Systems project (GASPS).
Aims. The paper presents an overview of the chemistry in the main water reservoirs in the disk around TW Hya. It discusses the limitations in the interpretation of observed water line fluxes.
Methods. We use a previously published thermo-chemical Protoplanetary Disk Model (ProDiMo) of the disk around TW Hya and study a range of chemical modeling uncertainties: metallicity, C/O ratio, and reaction pathways and rates leading to the formation of water. We provide results for the simplified assumption of Tgas = Tdust to quantify uncertainties arising for the complex heating/cooling processes of the gas and elaborate on limitations due to water line radiative transfer.
Results. We report new line detections of p-H2O (322−211) at 89.99 μm and CO J = 18−17 at 144.78 μm for the disk around TW Hya. Disk modeling shows that the far-IR fine structure lines ([O i], [C ii]) and molecular submm lines are very robust to uncertainties in the chemistry, while the water line fluxes can change by factors of a few. The water lines are optically thick, sub-thermally excited and can couple to the background continuum radiation field. The low-excitation water lines are also sensitive to uncertainties in the collision rates, e.g. with neutral hydrogen. The gas temperature plays an important role for the [O i] fine structure line fluxes, the water line fluxes originating from the inner disk as well as the high excitation CO, CH+ and OH lines.
Conclusions. Due to their sensitivity on chemical input data and radiative transfer, water lines have to be used cautiously for understanding details of the disk structure. Water lines covering a wide range of excitation energies provide access to the various gas phase water reservoirs (inside and outside the snow line) in protoplanetary disks and thus provide important information on where gas-phase water is potentially located. Experimental and/or theoretical collision rates for H2O with atomic hydrogen are needed to diminish uncertainties from water line radiative transfer.
Key words: astrochemistry / protoplanetary disks / stars: formation / radiative transfer / methods: numerical / line: formation
Herschel is an ESA space observatory with science instruments provided by European-led Principal Investigator consortia and with important participation from NASA.
Appendices are available in electronic form at http://www.aanda.org
© ESO, 2013
1. Introduction
Since the first detection of water in the disk around the low mass star AA Tau with the Spitzer Space Telescope by Carr & Najita (2008), protoplanetary disks have seen an increasing boom in water detections (Salyk et al. 2008; Najita et al. 2010; Pontoppidan et al. 2010b; Riviere-Marichalar et al. 2012). While Spitzer observations are spectrally unresolved, ground based observations have confirmed in several cases that the water is indeed circumstellar in origin by spatially and spectrally resolving the emission (Pontoppidan et al. 2010a). The excitation temperatures of the far-IR and submm water lines range from tens of K to 1000 K. Hence, they originate in very different radial zones of the disk. The strong mid-IR water lines discovered by Spitzer/IRS (e.g. Carr & Najita 2008; Salyk et al. 2008) and from the ground with VLT/CRIRES (Pontoppidan et al. 2010b) are inferred to originate inside a few AU and hence to trace the warm water reservoir inside the snow line. Glassgold et al. (2009) proposed that the warm water in the innermost disk is formed through warm neutral gas-phase chemistry and a more extensive discussion on the relevance of heating processes for the column densities of warm water can be found in Najita et al. (2011). Woitke et al. (2009b) identified three distinct water reservoirs in the disk around a typical Herbig Ae star: a warm high abundance inner water reservoir, a lower abundance warm surface layer driven by neutral-neutral chemistry and an outer cold water belt from photodesorption of icy grains.
While the presence of water in these disks is thus clearly established, the question
remains how sensitive the interpretation of the water lines is to details in the physics and
chemistry of the underlying disk models. Detailed multi-wavelengths disk observations and
modeling indicates that even relatively young disks can be very different from a
“prototypical disk” with a canonical gas-to-dust mass ratio of 100 (e.g. Tilling et al. 2012; Thi
et al. 2011a; Woitke et al. 2011; Meeus et al. 2010; Chapillon et al. 2010). Hence, we start answering these questions by choosing the
well known nearby and isolated disk around TW Hya (51 ± 4 pc, Mamajek 2005) that has an age ranging from 3 Myr (Vacca & Sandell 2011) to  Myr (Barrado
Y Navascués 2006). TW Hya has – despite its possibly unusual gas-to-dust mass ratio
–, a wide wavelength coverage in observations of water.
Myr (Barrado
Y Navascués 2006). TW Hya has – despite its possibly unusual gas-to-dust mass ratio
–, a wide wavelength coverage in observations of water.
TW Hya is a well studied disk with a rich set of observed atomic/molecular lines from the near-IR to the submm. Kastner et al. (1997) were the first to observe molecules such as 12CO, 13CO, HCO+, HCN, and CN in the disk around TW Hya. Subsequently, Thi et al. (2004) observed a series of CO, HCN, and HCO+ lines, whose profiles indicate an origin in the outer disk (Rout ~ 200 AU). The molecular emission arises from gas in Keplerian rotation (Qi et al. 2006) and the line ratios require gas temperature gradients different from that of the dust. Salyk et al. (2007) detected also a series of CO v = 1−0 ro-vibrational lines from inside 1 AU. Najita et al. (2010) report the non-detection of water in the Spitzer/IRS data of TW Hya at wavelengths of 5−14 μm. [Ne ii] and optical forbidden lines originating at 1−10 AU seem to trace a photoevaporative wind (Pascucci et al. 2011). A strong atomic oxygen line at 63 μm has been detected with Herschel/PACS (Thi et al. 2010a). Recently, Hogerheijde et al. (2011) have detected the ortho and para ground state water line in TW Hya with the HIFI instrument onboard the Herschel Space Observatory. The width of the lines point toward an origin in the outer disk.
Based on Herschel Science Demonstration Phase data, Thi et al. (2010a) found that a model with a gas-to-dust mass ratio of 1 can fit the current SED and PACS line data for TW Hya. The recent publication by Fogel et al. (2011) describes an alternative disk model for TW Hya with special focus also on the water abundances in the outer disk, suggesting that photodesorption by stellar UV and Ly α photons generates gas phase water abundances1 at the level of 10-6 in regions below 100 K. Hogerheijde et al. (2011) present another model for the disk around TW Hya especially focussing on the explanation of the observed HIFI water line fluxes. In both papers, dust settling of larger icy grains is invoked to yield lower water abundances of the order of 10-8; such a low water abundance can then explain the observed HIFI water line fluxes from the outer disk. In addition to that, Gorti et al. (2011) present yet another TW Hya model consistent with a large set of atomic/molecular line diagnostics; their model contains 6 × 10⁻²M⊙ of gas in the outer disk (4−200 AU).
In this paper, we report the new detection of the 89.99 μm para water line (322−211) and the CO J = 18−17 line in a deep PACS integration of TW Hya within the GASPS open time key program on the Herschel Space Observatory (Dent et al. 2013). However, instead of finding another “best fitting” model, we rather explore with the existing TW Hya model the range of water vapor abundances in the disk and the impact of chemical processes and input parameters on our disk model: elemental abundances, X-rays, photodesorption yields, water formation on dust surfaces, and water desorption channels. We also investigate the radiative transfer of water in more detail and assess the diagnostic value of this species for the overall disk structure.
2. Observations
We describe in the following the new Herschel/PACS observations of TW Hya, selected sub-mm lines from the literature and also Spitzer archival data used to support the analysis of water in this particular disk.
2.1. Herschel/PACS observations
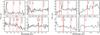 |
Fig. 1 Full set of TWHya PACS spectra obtained from the GASPS program including the deeper range scan. |
Our TW Hya observations are part of the Herschel open time key project GASPS (P.I. Dent), see Dent et al. (2013). We initially obtained PACS (Poglitsch et al. 2010) spectroscopy (obsid 1342187238 PacsRangeSpec, 5150 s and obsid 1342187127, PacsLineSpec, 1669 s) centered on 8 selected lines. In a later stage, we obtained a deeper range scan to confirm tentative detections (obsid 1342211845, 41 107 s). The observations were carried out in ChopNod mode, in order to be able to remove the emission of the telescope.
The spectroscopic data were reduced with the stable developers build version 8.0.1559 of the Herschel interactive processing environment (HIPE; Ott 2010), using standard tasks provided in HIPE. These include bad pixel flagging; Chop On/Off subtraction; spectral response function division; rebinning with oversample =2 and upsample =1 corresponding to the native resolution of the instrument; spectral flatfielding and finally averaging of the 2 Nod positions. The spectral resolution varies between 1100 and 3400. In order to conserve the best signal and not to introduce additional noise, we only extracted the central spaxel, and corrected for the flux loss with an aperture correction provided by the PACS instrument team (“pointSourceLossCorrection.py”). This was possible as the source was well-centered.
We extracted the line fluxes using a Gaussian fit to the emission lines with a first-order polynomial to the continuum, using the RMS on the continuum (excluding the line) to derive a 1σ error on the line by integrating a Gaussian with height equal to the continuum RMS and width of the instrumental FWHM. This approach is necessary as HIPE currently does not deliver errors. The absolute flux calibration error given by the PACS instrument team is currently 30%.
Herschel/PACS line fluxes are in 10-18 W/m2.
The spectra obtained in line and range scan show the presence of several lines of water, CO, and [O i]. Figure 1 shows in fact the tentative presence of many more molecular lines such as the hyperfine doublet of OH (79.11,79.18 μm). However, formally these are not 3σ detections. Table 1 summarizes the measured integrated fluxes and upper limits.
2.2. Data from the literature
In addition to Herschel/PACS data, we use the two water line detections reported by Hogerheijde et al. (2011) from the WISH program (van Dishoeck et al. 2011) using the HIFI instrument onboard the Herschel space observatory. Water has not been detected with Spitzer/IRS at wavelength below 20 μm (Najita et al. 2010). The Spitzer/IRS spectra that we use stems from Szulágyi et al. (2012) (SL module). In addition we use the upper limit for the [Fe ii] fine structure line at 25.99 μm (Carr & Najita, priv. comm.) to inform our choice of metal abundances.
We also include single dish sub-mm data on four lines, 12CO 3–2, 13CO 3–2, HCO+ 4–3, and HCN 4−3 from Thi et al. (2004) (see Tables D.2 and D.3). These lines are included because they provide stringent constraints on the outer disk structure and gas mass. The errors for the submm lines are calculated from the thermal noise provided in Table 3 of Thi et al. (2004) and a drift+systematic noise estimated to be 20% of the line Tmb. Since these observations originate from very deep integrations, an additional error could come from a wrong value of the beam efficiency correction which can vary with time. The fluxes agree with the previous single dish observations of Kastner et al. (1997) to within 10%. In the final comparison between observed and modeled line fluxes, we also take into account their 12CO 2−1 and 13CO 2−1 fluxes with their respective error bars: 0.136 ± 0.0067 and 0.0163 ± 0.0058 × 10⁻¹⁸ W/m2.
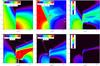 |
Fig. 2 Basic plots for the standard disk model: (1) total hydrogen number density with red/black contours overlaid showing the radial/total extinction of 1; (2) gas temperature with contours overlaid for the gas temperature (white) and dust temperature (black); (3) OH abundance with the vertical extinction of 0.01 and 0.1 overlaid by blue contours and the PDR parameter log χ/n⟨ H ⟩ = −2, ... −6 overlaid by white contours; (4) CO abundances with gas temperature contours (white) and dust temperature contours (black); (5) water abundance with the total extinction AV = 1 overlaid in black and the gas temperature contours (white) and (6) HCO+ abundance. |
3. The TW Hya disk model
The “standard” disk model used in this work is the Thi et al. (2010a) MCFOST/ProDiMo model with a gas mass of 3 × 10⁻³M⊙ (surface density power law Σ ∝ r-1). The grain size distribution is a continuous power law between 3 × 10⁻² μm and 10 cm with a power law index of 3.4 and the opacities are those for amorphous olivine. The large amax in our model is driven by the VLA detection of TW Hya at cm wavelength (Wilner et al. 2000)2. It is a fully parametrized disk model without any vertical structure iteration, but the chemistry and gas temperature are calculated self-consistently. The model has an optically thin inner dust disk from 0.25 to 4 AU containing 1.2 × 10⁻⁹M⊙ in grains up to 1 mm (2 × 10⁻⁸M⊙ in grains up to 10 cm). The outer dust disk (4−196 AU) has a mass of 1.9 × 10⁻⁴M⊙ in grains up to 1 mm (3 × 10⁻³M⊙ in grains up to 10 cm) and extends to 196 AU. The total dust mass in grains up to 10 cm implies a gas-to-dust mass ratio of 1. The mean surface area of the dust is ⟨ a2 ⟩ = 5.4 × 10⁻¹¹ cm2. The PAH abundance is 0.01 wrt the standard interstellar medium (ISM) abundance (10-6.52 PAH molecules/H-nucleus). The “standard” disk model does not include X-rays to enable a direct comparison with the previous results of Thi et al. (2010a). However, we explore the role of X-rays on the water chemistry in the general sensitivity analysis. The resolution of the models presented here – unless noted otherwise – is 200 × 140 grid points; a logarithmic radial grid enables us to equally well sample the inner and outer disk. More details and a full table of modeling input parameters can be found in Thi et al. (2010a). Details about the 3D Monte Carlo radiative transfer code MCFOST can be found in Pinte et al. (2006, 2009). Details on the thermo-chemical disk modeling code Protoplanetary Disk Models (ProDiMo) are discussed in a series of papers (Woitke et al. 2009a, 2011; Kamp et al. 2010; Thi et al. 2011b; Aresu et al. 2011; Meijerink et al. 2012). Our chemistry is based on the UMIST2007 database (Woodall et al. 2007). Details on the atomic and molecular data used to calculate the statistical equilibrium and line radiative transfer are provided in Appendix A.
The elemental abundances are changed with respect to the original paper to reflect the low metallicity of the original ISM material that formed the disk in the first place (Table 2). The data are taken from Jenkins (2009), Col. 7 of his Table 4 and are referred to as “low metal” case.
TW Hya has an observed LX of 1.3 × 1030 erg/s (Kastner et al. 2002). This is an average X-ray luminosity for low mass young stellar objects (Güdel et al. 2007). However, based on our recent modeling of the impact of LX versus LFUV (Meijerink et al. 2012; Aresu et al. 2012), we expect the disk to be dominated by FUV. We ran two extra models including X-rays to show the impact on the gas emission lines studied here.
3.1. Physical and chemical disk structure
Figure 2 illustrates the total hydrogen number density, radial and vertical extinction, gas and dust temperatures and the OH, CO, H2O and HCO+ abundances of the “standard” model.
The inner disk is optically thin to interstellar UV photons and thus contains very low molecular abundances (CO and water). In the inner tenuous disk, OH mainly forms through the endothermic reaction (activation energy Ea = 3150 K) of molecular hydrogen with atomic oxygen. Gas temperatures in the inner disk are of the order of 1000 K.
In the outer disk, the top OH layer builds up through reactions of atomic oxygen with
photo-excited H2 and NH; NH itself also being the product of N collisions with
excited molecular hydrogen. The reaction of atomic oxygen with NH can either lead to NO or
OH with a branching ratio of 7% (Adamson et al.
1994). The rate leading to OH though varies in the chemistry databases ranging
between 1.16 × 10⁻¹¹ cm3 s-1 (UMIST, OSU) and zero
(KIDA). The HCO+ chemistry and its dependence on electron density (and thus
metallicity of the gas) is discussed in some more detail in Appendix B. CO in the outer disk forms at the disk surface via ions and
ion-molecules such as C+, CO+ and HCO+, HOC+.
At intermediate layers neutral-neutral chemistry dominates (CH + O, C + NO and
O + C2). In all layers, the main destruction mechanisms are photodissociation
and/or freeze-out of CO. Deeper into the disk, an equilibrium is reached between
thermal-/photo-desorption and freeze-out, except in very shielded regions where
H (generated by cosmic rays) adds to the
destruction channel. The water chemistry will be discussed in detail in Sect. 4.
(generated by cosmic rays) adds to the
destruction channel. The water chemistry will be discussed in detail in Sect. 4.
Elemental abundances for the standard model taken from Jenkins (2009).
3.2. Comparison with other disk models
We do not include Ly α emission in our input spectrum. Ly α line photons can be more efficiently resonantly scattered deep into the disk compared to the UV continuum (Bergin et al. 2003). The presence of Ly α photons deep inside a non-settled disk model of TW Hya does change the abundance pattern of HCN, but has very little impact on e.g. CO (Fogel et al. 2011); for some species such as water and OH, Ly α dissociation is roughly compensated by increased Ly α photodesorption.
Hogerheijde et al. (2011) used the same underlying 2D density structure and grain size distribution as Thi et al. (2010a) and hence as our “standard model”. However, the dust temperatures and gas chemical composition are recalculated using different codes and assuming Tgas = Tdust. According to our disk model, the latter assumption is fairly good in the regions where the fundamental water lines originate; differences in those regions between gas and dust temperatures are lower than a factor 2 in our “standard model”. Another important difference in our modeling strategy is that Hogerheijde et al. (2011) assume that the ice reservoir remains the primordial one even if they decrease the disk gas mass. We assume in this paper steady state chemistry which involves an overall lower mass ice reservoir on small grains in an evolved (lower gas-to-dust mass ratio) disk. In models that take into account the time-dependent chemistry in the cosmic-ray dominated midplane, water ice can even form at late times (one to a few Myr) processing oxygen from CO into water (Chaparro Molano & Kamp 2012).
Radial zones in which the water lines form.
4. The water reservoirs in the standard model
The PACS lines studied within the GASPS program have upper level energies between 100 and 1000 K. Water lines in the 4−30 μm range have excitation energies of 1000−3000 K. The two HIFI lines at 538.28 and 269.27 μm have upper level energies well below 100 K. Such low excitation lines are therefore thought to originate in the outer disk, where the temperatures are low enough for water to freeze out on dust grains.
Table 3 shows where the Herschel lines form according to our standard disk model. The radii within which 15% and 85% of the line emission arises are calculated using a simplified vertical escape probability. Since the inclination of the disk around TW Hya is only 7°, these values should be a good approximation. The lines fall into three categories: (1) lines from the warm gas of the inner rim of the outer disk (4−4.5 AU); (2) lines from the cold gas of the outer disk (beyond 20 AU); and (3) lines that originate in a range spanning both parts of the disk (4−100 AU). There is a single line in the latter category, the 179.53 μm line with a low upper level energy of ~114.4 K. Interestingly, the higher excitation lines are preferentially detected in the disk around TW Hya with Herschel (e.g. 89.99 μm, Eup = 296.8 K); according to our model, these lines originate from the inner rim of the outer disk. As a side note, the one CO line clearly detected with PACS (144.78 μm) originates from a similar radial region: 4−5 AU.
Overview of the model series and respective parameters touched.
The mass of water in the inner disk (<4 AU) is 1.4 × 10⁻¹⁴M⊙ and its average gas temperature3 is 670 K. The outer gas-phase water reservoir (4−196 AU) contains 2.2 × 10⁻¹¹M⊙, which is at temperatures below 20 K. Water ice in the outer disk (4−196 AU) adds up to a mass of 7.7 × 10⁻⁶M⊙.
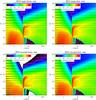 |
Fig. 3 Primary and secondary formation and destruction rates for gas phase water in the “standard” disk model (grid resolution 100 × 70). The numbers listed for every second grid point refer to the reactions listed in Table 5. |
4.1. Water chemistry in the disk
We analyze in some more detail the water chemistry in the surface layers of the outer disk at 0.01 < AV < 3 to understand the role of gas phase and surface chemistry and water photodesorption in particular.
The main water desorption channel in the outer disk is photodesorption. The reason for this are the cool temperatures, below 100 K for gas and dust, in the outer disk of TW Hya. At such low temperatures, thermal desorption is negligible and water abundances reach levels of ~10-8. Figure 3 summarizes the two main formation/destruction channels for water vapor in the disk. Interestingly, gas phase formation of water dominates the chemical balance at AV ≲ 1. Only at higher extinction (AV ~ 3), the detailed balance is between water photodesorption from and adsorption on grains (formation reaction 15, destruction reaction 11). Water destruction in the upper atmosphere is not only through UV photons, but also through collisions with C+, Si+ and H+. One of the most important gas phase formation routes is radiative association through OH + H. This channel is efficient due to the relative high abundance of H (H/H2 of the order of 10−3...4) in layers where the OH abundance peaks. Gas temperatures here are ~40 K, high enough for some atoms/molecules to overcome the activation barrier of this reaction (90 K).
Inside 2 AU, efficient warm gas phase chemistry (Tgas > 250 K) can increase the water gas phase abundances up to levels of 10-6 for higher gas disk masses (gas-to-dust ratio of 100) (see Thi et al. 2010b, for a more detailed discussion). The main channel is here H2 + OH. A similar conclusion on the warm neutral chemistry leading to water formation was reached by Glassgold et al. (2009) and Najita et al. (2011).
Formation and destruction reactions for water.
Figure 3 shows a small region close to the inner rim where water is formed through NH2 and/or OH. Formation of OH involves the reaction NH + O with disputed rate coefficients (see Sect. 3). Removing all nitrogen chemistry from the “standard” model has a minor impact on the water abundance structure, confirming that other channels such as water photodissociation contribute at roughly equal efficiency to the formation of OH.
A comparison of the OH (Fig. 2) and the water abundance distribution in the standard model, shows that the gas-phase formation of water in the upper disk layers is a process that scales strongly with density. A first step is the formation of OH and the first peak of the OH abundance is above AV = 0.01. Water only starts to become abundant below the OH layer. The OH abundance shows two distinct layers. In the first one around AV = 0.01, dissociative recombination of ion molecules such as H2O+ plays a large role in OH formation. The second layer of higher OH abundance originates besides nitrogen chemistry from water photodissociation (see also Fig. 3). The low abundance layer of OH, NO, NH around the layer r = 10−100 AU, z = 2.4−28 AU coincides with χ/n⟨ H ⟩ ~ 10-5 (The quantity χ/n⟨ H ⟩ is the classical PDR parameter, the ratio between the strength of the FUV radiation field, 912−2050 Å, and the total hydrogen number density).
4.2. The water ortho/para ratio
ProDiMo calculates the local thermodynamic equilibrum (LTE) ortho/para ratio (o/p ratio) using the gas temperature found from the gas thermal equilibrium. Figure 4 shows the o/p ratio of water in the “standard” disk model.
There is a strong vertical Tgas gradient above the radial extinction AV,rad = 1 layer (Fig. 2); here the o/p water ratio changes quickly reaching the maximum value of 3 at the inner rim of the outer disk (4−8 AU). In general, the radial gradient of the o/p ratio reflects the radial gas temperature gradient. Where the gas temperature reaches values below 20 K in the outer disk, the o/p ratio drops below 1.
5. A study of underlying modeling uncertainties
A disk model is defined by a set of input parameters, but also by a set of processes (chemical and physical) such as photodesorption and surface chemistry and a set of numerical recipes such as the radiative transfer method. The following sections contain “numerical experiments” to understand underlying modeling uncertainties due to the implementation of processes and radiative transfer methods. The goal is to assess the diagnostic power of individual water line observations and to set the stage for physics beyond the homogeneously mixed stationary disk models, such as invoking inhomogeneous dust properties (e.g. dust settling, radial gradient in dust properties), radial and vertical mixing of gas, and non-equilibrium chemistry. During these “experiments”, the main parameters leading to the density structure, dust temperatures/opacities and stellar/interstellar radiation are kept unchanged. However, chemical abundances, gas temperatures, species level populations (1 + 1D escape probability) and line radiative transfer are intrinsically coupled, thereby changing the emergent fluxes in a complex way. The “experiments” carried out include the C/O ratio, water self-shielding, X-rays, photodesorption and surface chemistry. The basic model series is summarized in Table 4 and the resulting water abundances are shown in Fig. 5. The impact of each “experiment” on the resulting water abundance structure is discussed in Sect. 5.1.
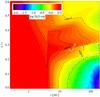 |
Fig. 4 Water ortho/para ratio in the standard model. Black contours show o/p ratios of 0.5, 1, 1.5, 2, 2.5 and 3. White contours denote gas temperatures of 20 and 50 K. |
For all these models, we ran the line radiative transfer of the series of atomic and molecular lines described in Sect. 2 based on the level populations obtained from a 1 + 1D escape probability (Woitke et al. 2009a). The inclination for the TW Hya disk model is fixed to 7°. Tables D.2 and D.3 provide an overview of the resulting fluxes in comparison with the observed values and a detailed discussion is presented in Sect. 5.2.
5.1. Chemistry
The following paragraphs focus on a sensitivity analysis for the water abundance structure within the model series described in Table 4.
5.1.1. X-rays (model 2 and 8)
Including X-rays increases the gas temperature in the disk surface at heights above
AV,rad > 1 due to Coulomb heating.
X-rays slightly enhance the abundance of H in the disk surface, resulting in a
vertically more extended HCO+ layer. That same layer now also hosts
H2O+ and H3O+, albeit at low abundance
levels (10-9−10-10). The abundances of the other species, atomic
oxygen, ionized carbon, CH+, CO and HCN are not significantly affected. The
same behavior of these species with respect to X-rays has been noted by Najita et al. (2011). Due to the higher abundances of
H2O+ and H3O+, water formation in the gas
phase becomes more efficient and the water vapor layer becomes thicker (i.e. vertically
more extended, Fig. 5 model 2). However, the total
amount of water vapor and also the hot water reservoir changes by less than 10%.
5.1.2. C/O ratio (model 4)
The C/O ratio is crucial in determining whether carbon or oxygen-rich chemistry develops. If the limiting abundance is that of oxygen, the formation of CO binds the entire oxygen reservoir hence leaving the remaining C atoms to form CH chains and nitrogen bearing molecules molecules such as HCN. If a surplus of oxygen exists, CO formation will consume most of the carbon and water can still form at high abundances.
There is limited evidence for how the C/O ratio evolves during the star and planet formation phase. The C/O ratio in the Sun is 0.4 (Anders & Grevesse 1989), so very oxygen rich. We have also evidence for the C/O ratio in the precursor dense ISM material to be smaller than one, C/O = 0.54 (e.g. Jenkins 2009). In a mature planetary system, our calibration point are cometary compositions in the Solar System (e.g. Bockelée-Morvan 2010), C/O = 0.45, which are representing the ice phase. To which extent the gas-phase C/O ratio is constant throughout the protoplanetary disks and how it may change as the disk evolves is unclear. Large scale mixing processes, dust settling, the formation of ices all can affect locally as well as globally the gas-phase C/O ratio in a disk (e.g. Ciesla & Cuzzi 2006; Hogerheijde et al. 2011).
In model 4, we assume an elemental C/O ratio larger than one, i.e. C/O = 1.86 (12 + log ϵ(O) = 7.98, 12 + log ϵ(C) = 8.25). As a result, the water abundance in the disk is suppressed (compare model 1 and 4 in Fig. 5), especially in deeper surface layers. This is largely a chemical effect because the temperature structure of the disk does not change significantly. In a carbon rich environment, CO takes up most of the oxygen until freeze-out temperatures of CO are reached around 20 K. There is a substantially smaller and lower mass water ice reservoir, M(H2O#) = 3.7 × 10⁻⁷M⊙, a factor 20 less than in the “standard” model.
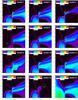 |
Fig. 5 Water gas phase abundance in the TW Hya disk model (from top left to bottom right): standard model (model 1), with 1/1000 of the low ISM metallicity (model 3), C/O ratio of 1.86 (model 4), Tgas = Tdust (model 5), without water self shielding (model 6), water on surfaces (model 7), without water adsorption (model 9), with 100 times higher surface reaction rates (model 10), with two different desorption channels (model 11), with 10 active grain surface layers instead of 2 (model 12), without water photodesorption (the outer water reservoir is gone, model 13), and the standard model with a 100 times higher gas mass in the disk inside 4 AU (model 14). White dashed contours: gas temperatures of 200 and 2000 K. Red dashed contours: vertical AV. Black dashed contours: minimum of radial and vertical AV. |
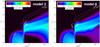 |
Fig. 5 Continued. Water gas phase abundance in the TW Hya disk model. Left: standard model with X-rays (model 2). Right: water on surfaces with X-rays (model 8). White dashed contours: gas temperatures of 200 and 2000 K. Black dashed contours: minimum of radial and vertical AV. |
5.1.3. Tgas = Tdust (model 5)
Model 5 contains O and OH ice as species, but now with the assumption that the gas temperature equals the dust temperature throughout the disk model. The disk inside a few AU becomes then too cold for an efficient gas phase formation of water (model 5 in Fig. 5, where the inner water reservoir is absent). Even the outer disk gas phase water formation via ion-molecule chemistry is less efficient.
5.1.4. No water self-shielding (model 6)
We study the impact of the self-shielding on the water abundance by switching the process off (model 6). This should maximize the ionization/dissociation of atoms/molecules for all species except CO, and H2, where the self-shielding is taken into account via extensive tables of shielding coefficients. Also for C, the self-shielding is calculated directly from the photoionization cross section provided in the code.
For the “standard” TW Hya disk model, the impact of water self-shielding is rather small (Fig. 5, model 6) compared to what is seen by Bethell & Bergin (2009) for a disk model with strong dust settling. In the absence of grain settling, continuum absorption by dust dominates the shielding of the photodissociation process.
5.1.5. Water formation on grain surfaces (model 7−10)
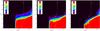 |
Fig. 6 Water ice abundance with surface reactions (left, model 7), with changed water desorption processes (middle, model 11) and without water adsorption from the gas phase (model 9) – all water ice being formed by surface reactions (right). The white contours denote dust temperatures of 20 and 50 K. |
If we include O and OH ice as species and also surface reactions, these ices are further processed on the grain into water ice (see Appendix C). The water ice abundance for model 7 is shown in Fig. 6 (left panel). The efficiency of water formation on the grain surface itself has been tested by switching off the water adsorption reaction (model 9); then water ice can only form through reactions of O and OH ice on the grain surface (see right panel of Fig. 6).
In the presence of water formation on surfaces, the water vapor abundance at 150 AU close to the midplane (z/r < 0.2) shows a much steeper decline from 10-8 to 10-11 compared to the model without water formation on grain surfaces. In addition, the model with grain surface chemistry shows much lower levels of atomic oxygen below z/r < 0.2. Oxygen freezes out at these temperatures and – besides water ice being the main reservoir – ends up preferentially at the same abundance level in OH ice and in gas phase CO.
Fogel et al. (2011) assume a continuous power law grain size distribution with an exponent of −3.5 with amin = 0.005 and amax,small = 0.25 μm and a single population of large 1 mm grains. In contrast to that, our disk model contains a continuous distribution of grains between 0.03 and 10 cm with a power law exponent of −3.4. Hence our model has a largely reduced grain surface area available for surface reactions compared to the Fogel et al. (2011) model. To assess the importance of the available grain surface, we artificially scale the rate coefficient for grain surface reactions by a factor 100 (model 10). The abundance distribution of water vapor in the outer disk increases (Fig. 5). The larger grain surface area increases the photodesorption rates of ices back into the gas phase and thus provides a source of oxygen for the gas phase water formation.
5.1.6. Water desorption (model 11−13)
Ceccarelli et al. (2005) noted the possibility that water can be desorbed from the cold icy grains in the outer disk by UV and/or X-ray photons. This process has then been studied more quantitatively by Dominik et al. (2005), using experimental water photodesorption yields from Westley et al. (1995) and the binding energy measured by Fraser et al. (2001) (Eads = 5600 K). They find typical water vapor abundances of ~10-7 in the disk surface.
Öberg et al. (2009) have recently measured again the photodesorption yields in the lab resulting in a total yield (OH and H2O) of Y = 1.94 × 10⁻³ photon-1 at 20 K. This is close to the previous experiments by Westley et al. (1995) and also within a factor four of the theoretically calculated ones (Arasa et al. 2010). We assume here the photodesorption yields and adsorption energy used by Hollenbach et al. (2009) for comparison reasons: Y(H2O) = 10-3 and Y(OH) = 2 × 10⁻³, Eads = 4800 K (Aikawa et al. 1996). The exact value of the photodesorption yield in the range 10-3−10-5 was found to be less important (Semenov & Wiebe 2011).
Andersson & van Dishoeck (2008) showed that roughly two third of the water ice is actually dissociated by the incoming UV photon and desorbs as OH and H. Using this additional OH photodesorption channel, the outer cold water reservoir does not change significantly (Fig. 5, model 11). Changing the adsorption energy to the higher value of 5600 K has a minor effect on the inner water vapor reservoir, but enhances the mass of the outer cold water vapor reservoir from 8.7 × 10⁻⁷ to 9.0 × 10⁻⁷MEarth.
If the number of active layers for photoevaporation from ices is increased from Nlay = 2 to 10, the change in the gas phase water abundances is negligible (Fig. 5, model 12).
The entire outer water reservoir is due to photodesorption of water ice from the grain surfaces. Removing that process from the chemical network leaves only the inner water reservoir remaining (Fig. 5, model 13); in the outer disk, oxygen is not returned back into the gas phase. The “standard” model has a total water reservoir of 7.3 × 10⁻⁶ MEarth of which less than 1% resides inside the gap. Removing photodesorption as the main source of cold water in the outer disk reduces the mass of water there by four orders of magnitude. However, reducing the photodesorption yields by only a factor 10 does not affect the water abundance in the outer disk.
5.2. Emergent line fluxes
For all models described above, we calculate the atomic/molecular line fluxes that are in the PACS range in Tables D.2 and D.3. In addition to those lines, we also list the water lines accessible with HIFI and a selection of submm lines of CO, HCO+ and HCN. These lines provide additional constraints on the irradiation environment, the electron density and the disk gas mass. As an example, X-rays are found to enhance the HCN abundance (e.g. Aikawa & Herbst 2001) and high electron abundances can keep the HCO+ abundance low (e.g. Qi et al. 2003). Also water self-shielding can affect OH abundances, because one of the processes forming OH – among many others – is photodissociation of water. The following sections focus on the water line fluxes and some high excitation lines originating at the inner rim. A brief discussion on the fine structure lines and submmm line fluxes can be found in Appendix D.
5.2.1. Water lines
A comparison of water line fluxes for all models of the series is presented in Fig. 7. In most cases, the fluxes change by less than a factor 3 with respect to the standard model of the series (model 1 and model 7). The largest difference in water line fluxes are seen for the model with Tgas = Tdust (model 5). Due to the lower gas temperatures, the line formation region for most water lines becomes smaller, except for the HIFI line at 538.29 μm, which originates in both cases between 30 and 200 AU. All lines with a low excitation temperature (both HIFI lines and the PACS 179.53 and 180.49 μm lines) are less affected. Increasing the C/O ratio to 1.86 (model 4), affects the HIFI water lines leading to a factor 30−50 lower fluxes.
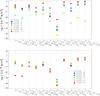 |
Fig. 7 Sensitivity of the water lines in the model series without grain surface chemistry (top) and with grain surface chemistry (bottom). |
If grain surface reactions are added (model 1 versus model 7), the fundamental water lines get weaker by a factor two. The higher excitation lines do not change at all since they all originate in much warmer gas where grain surface formation of water plays no role. Including the two channels for water photodesorption (H2O and OH+H) does not change the line fluxes of the HIFI water lines by more than 35%. The PACS lines change typically by 10%. Changing the adsorption energy to the higher value of 5600 K, changes the higher excitation water line fluxes by less than 20%, while it changes the HIFI lines by up to a factor 1.6.
If the inner disk has a higher gas-to-dust mass ratio of 100 (model 14), the PACS high-excitation water lines change by a factor of a few to 10. While this brings the 89.988 μm line flux into agreement with the observed one, it does not violate any upper limits within 3σ.
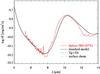 |
Fig. 8 TW Hya low-resolution IRS spectrum (red) scaled by a factor 0.85. Overplotted in black are the TW Hya models (“standard” model – solid line; model with Tgas = Tdust – dashed line; model with water formation on dust surfaces – dotted line, indistinguishable from solid line) convolved to give a resolution of 100. |
Selected CO, water and H2 lines with their observed fluxes (Salyk et al. 2007; Najita et al. 2010; Zhang et al. 2013) in the near- and mid-IR wavelength range from the “standard model” (model 1) and the model with 100 times higher gas mass inside 4 AU (model 14).
If the photodesorption process is omitted (model 13), the low energy water lines such as the 538.29 μm line become a factor 100 weaker, but also much broader (~3 km s-1) because they now originate in the inner disk. The “standard” model predicts a FWHM of 1.0 km s-1 for the 538.29 μm line and a FWHM of 1.14 km s-1 for the 269.27 μm line. The observed FWHM of the two lines are 0.96 km s-1 and 1.17 km s-1 respectively (Hogerheijde et al. 2011). Our model 7 can fit the observed HIFI water lines without an assumption of icy grain settling; the lines are optically thick and also very sensitive to the details of the radiative transfer (e.g. number of collision partners, radiative transfer method, see Sect. 5.2.2). The o/p water vapor mass ratio in the model is 0.3, a factor ~2 lower than the one in the model by Hogerheijde et al. (2011).
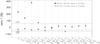 |
Fig. 9 Percentage change in line fluxes for a series of water lines. The plus signs are a comparison between the fluxes from the “standard” model and the fluxes computed with MCFOST using the level populations of the “standard” model (large water molecule, 70 × 70). The asterisks are a comparison between the “standard” model with the new LAMDA file and the small water molecule and the MCFOST run. Note that MCFOST contains only H2 collisions. |
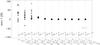 |
Fig. 10 Percentage change in line fluxes for a series of water lines due to varying collision cross sections randomly within a factor 10. The symbols correspond to 10 different sets of collision cross sections. The labeling of the x-axis shows the excitation temperature of the upper level (top) and the line identification with wavelength (bottom). |
Szulágyi et al. (2012) published a Spitzer low resolution short wavelength spectrum of TW Hya (Fig. 8). Degraded to the appropriate resolution of 100, our “standard” model does not show any signatures of water between 5 and 8 μm that stick out above the Spitzer noise level. However, this is partially due to the poor resolution of the SL Spitzer mode. Spitzer spectra in the 20−40 μm range have a resolution of 600 and there water lines are clearly visible next to a few OH lines. Table 6 lists a selection of high-excitation line fluxes in the near- and mid-IR wavelength range calculated from simplified vertical escape probability. Note that a more detailed comparison with Spitzer observations needs to take into account that many water lines overlap at this resolution, allowing only blends to be measured instead of individual line fluxes.
5.2.2. The statistical equilibrium and line transfer of water
We tested the formal water line radiative transfer of ProDiMo against the 3D Monte Carlo radiative transfer code MCFOST (Pinte et al. 2006, 2009) for a series of our water lines. The line radiative transfer is implemented such that it uses the level populations from ProDiMo as starting point. To remove gridding uncertainties and possible interpolation uncertainties, we used the same grid (100 × 70) and line fluxes calculated with an inclination angle of 0°. For the three lines originating in the outer disk, 538.29, 269.27 and 179.53 μm, the agreement of the line flux predictions is within 40% (Fig. 9). Some of the higher excitation lines deviate by up to 60%.
Ortho/para water line ratios of lines that are close in excitation energy in the model series.
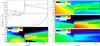 |
Fig. 11 Left: optical depth, cumulative line fluxes and zone where the water 538.29 μm line originates in our “standard” model. The optical depth is obtained from vertical escape probability which is a good approximation in the case of the TW Hya disk which has a low inclination of 7°. The zone of line formation outlined by black dashed contours that denote where 15 to 85% of the flux build up vertically and radially; the black solid line encloses thus 50% of the total line emission. The blue contours show total hydrogen number densities of 107 and 108 cm-3. Right: density of the collision partners H, H2 and e− with the line forming region of the 538.29 μm line superimposed. |
The HIFI water lines are slightly sub-thermal in our disk model; line fluxes are a factor ~3 lower than LTE. At the same time, the lines are optically thick (Fig. 11) and the dust provides a strong continuum flux at 300−500 μm; continuum optical depth across the fundamental water line (538.29 and 269.27 μm) emission region are between 0.1 and a few (Fig. 11). In the absence of this continuum, the lines would be optically thick, but effectively thin; this means that water line photons are resonantly scattered until they reach the disk surface and escape. Resonant scattering of water line photons has been studied for example by Poelman et al. (2007). Whether the water line photons can resonantly escape depends critically on the details of the local dust opacity, i.e. what is the probability that a line photon escapes after a certain number of scatter event without encountering a dust grain. In our model, the excitation temperature of the upper level is very close to the radiative temperature, indicating that far-IR pumping is efficient. With increasing excitation energy, the excitation temperature deviates more from the radiative temperature. In all cases, the gas temperature is higher than the excitation temperature.
A comparison between excitation temperatures from the 1+1D escape probability and from the Monte Carlo method shows clear differences due to the limited amount of directions used in escape probability. Even though absolute differences may not be large, the low excitation lines react very sensitively to small changes in level populations. With the caveat of using a different number of collision partners in ProDiMo and MCFOST, Fig. 9 shows that the low excitation line fluxes can vary by a factor 2−4 between the two codes. This is partially due to differences in collision cross sections and partially due to the radiative transfer method for calculating level populations.
Figure 11 shows the densities of the main
collision partners H, H2 and electrons in the “standard” model. In the main
water line forming region, atomic hydrogen densities are only about an order of
magnitude smaller than H2. Collisions between water and atomic hydrogen are
included based on a scaling of the respective H2 collision cross sections.
However, this approach could be wrong by an order of magnitude given the generally
higher reactivity of hydrogen. To assess the relevance of the collision cross sections
on determining level populations for water, we carry out a sensitivity analysis where we
vary randomly the cross sections Cij within
an order of magnitude 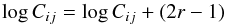 (1)with r being a random
number between 0 and 1. We ran ten “standard” models with randomly varied cross sections
and compare the resulting line fluxes in Fig. 10
to those of model 1. The only three lines affected are those with low excitation
energies (the two HIFI lines and the PACS 179.53 μm line). They change
within a factor two, while all other high excitation lines stay within 10%. A possible
explanation is that the high excitation lines originate close to the inner rim of the
outer disk, where the dust temperature is higher (70−110 K) and the level populations
could be dominated by IR pumping (Daniel et al.
2012). A possibility to quantify this radiative pumping is to compare the
excitation temperature of a lines upper level Tex with the
temperature of the radiation field at that wavelength Trad
and the local gas temperature Tgas. The 63.3
μm line is one of the water lines that forms at the inner rim of the
outer disk. Its ratio Tex/Trad
across the line forming region is ~1, while the ratio
Tex/Tgas is close to 0.2.
(1)with r being a random
number between 0 and 1. We ran ten “standard” models with randomly varied cross sections
and compare the resulting line fluxes in Fig. 10
to those of model 1. The only three lines affected are those with low excitation
energies (the two HIFI lines and the PACS 179.53 μm line). They change
within a factor two, while all other high excitation lines stay within 10%. A possible
explanation is that the high excitation lines originate close to the inner rim of the
outer disk, where the dust temperature is higher (70−110 K) and the level populations
could be dominated by IR pumping (Daniel et al.
2012). A possibility to quantify this radiative pumping is to compare the
excitation temperature of a lines upper level Tex with the
temperature of the radiation field at that wavelength Trad
and the local gas temperature Tgas. The 63.3
μm line is one of the water lines that forms at the inner rim of the
outer disk. Its ratio Tex/Trad
across the line forming region is ~1, while the ratio
Tex/Tgas is close to 0.2.
5.2.3. The water o/p line ratios
The observed o/p line flux ratio for the fundamental lines is 0.27 (Hogerheijde et al. 2011). Table 7 shows the line o/p ratio from our model series for two sets of ortho and para water lines being very close in excitation energy: the ratio of the fundamental 538.29 and 269.27 μm lines and the ratio of the high excitation 78.74 and 78.93 μm lines.
If the lines are optically thick, the o/p line ratio does not necessarily reflect the chemical o/p water ratio. In our model, the fundamental lines are optically thick as shown in Fig. 11. The lines originate in layers, where the total hydrogen number density is close to the critical densities for these lines at low temperature (ncr = 2 × 10⁷ and 2 × 108 cm-3 respectively for the 538.29 and the 269.27 μm line at T ~ 50 K). The level populations are slightly sub thermal leading to line fluxes that are a factor 3.6 (538.29 μm) and 4.3 (269.27 μm) smaller than the LTE values.
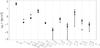 |
Fig. 12 Comparison between selected observed line fluxes and the standard model with two zones (inside 4 AU a gas-to-dust mass ratio of 0.01 and outside 1.0). HCO+ fluxes are from the model with a 1000 times lower metallicity. Observed fluxes are denoted by filled circles with 3σ error bars and model fluxes by diamonds. |
Experiments by Abouaf-Marguin et al. (2009) show that nuclear spin conversion of water captured in a xenon matrix is fast (~100 min) at very low temperatures of a few Kelvin. Theoretical calculations of Buntkowsky et al. (2008) show that this happens in an ice matrix even on timescales of milliseconds. Recent experiments (Hama et al. 2011) suggest that the o/p ratio of thermally desorbed water – originally deposited at 8 K – is always close to three, which is the high temperature limit. It remains unclear however, whether photodesorption affects the o/p ratio of the liberated water ice. In addition, our “standard” model shows that most of the water vapor is re-formed in the gas phase and should thus rather reflect the LTE o/p ratio corresponding to Tgas (Fig. 4).
5.2.4. Lines from inner disk and inner rim of the outer disk
The lines originating inside r ≲ 6 AU are the CH+ lines, the CO high J rotational lines and the OH hyperfine structure lines. Since they form in warmer disk regions, grain surface chemistry plays no significant role. The C/O ratio changes the high J CO rotational lines, increasing fluxes by up to a factor ~10 (see Fig. D.1). Tgas = Tdust is important for the OH lines (less formation of OH at low temperatures) and the high J CO rotational lines (lower excitation temperatures).
The molecular abundances inside 4 AU change substantially in model 14 with a gas-to-dust mass ratio of 100 in the inner disk. This increases the line fluxes from high excitation lines such as the CO high J rotational lines, CO ro-vibrational lines and water high excitation lines. Table 6 lists selected line fluxes in addition to the ones listed in Tables D.2 and D.3. Fluxes change by one to two orders of magnitude, thus bringing them closer to the observed values (our PACS data and Najita et al. 2010; Salyk et al. 2007).
6. Comparison with observations
Figure 12 shows a comparison between our observed line fluxes and the two-zone standard model (inside 4 AU a gas-to-dust mass ratio of 0.01 and outside 1.0) except for the HCO+ line which is taken from the extremely low (1/1000) metal abundance model (model 3). The agreement is for most lines within a factor two, also for the low-excitation water lines. Given the results from the sensitivity analysis in Sect. 5.2, pushing the models any further is of limited value.
The model flux for HCO+ J = 4−3 is still too weak. The line originates in a very thin layer and is optically thin based on a simple vertical escape probability estimate. Scaling the gas mass up by a factor 10 in the “standard” model, changes the HCO+ line flux only by 20%.
Not shown in Fig. 12 is the reasonable agreement of the CO ro-vib lines in the model with a more canonical gas-to-dust mass ratio of 100 in the inner disk (see Table 6) with the observed CO ro-vib fluxes of Salyk et al. (2007) (2−12 × 10-18 W/m-2). The FWHM of ~13 km s-1 found in the modeled lines is also consistent with the observed data. In that very same model, the p-H2O line flux at 89.99 μm reaches 3.54 × 10⁻¹⁸ W/m2, while all other water lines originating in the inner disk stay below their 3σ upper limits from the Herschel/PACS observations.
Other groups found a much higher gas-to-dust mass ratio for the outer disk of TW Hya (Gorti et al. 2011; Bergin et al. 2013). However, these works have not included the strong constraint from the 12CO/13CO line ratio that Thi et al. (2010a) found decisive in setting the gas mass of the outer disk (assuming canonical C and O abundances and equilibrium chemistry). Sections 5.1.2 and 5.2.1 and 5.2.4 show that increasing the C/O ratio has opposing effects on the fluxes of the fundamental water lines and high J CO lines, while leaving the CO submm lines almost unchanged (see also Table D.2). The stability of the CO submm isotopic line ratio (see Sect. D.2) makes it difficult to reconcile the observations with a higher gas mass in the outer disk.
If the gas-to-dust ratio is indeed lower than the ISM in the outer disk, the possibility that this ratio increases toward the inner disk is interesting in the context of planet formation models and disk evolution. If gas evolution is related to the orbital timescale, it should be faster in the inner disk. Finding a primordial gas-to-dust mass ratio inside 4 AU and a lower gas-to-dust mass ratio in the outer disk would exclude the possibility that gas and dust migrate together from the outer disk to the inner disk. Evolution of both parts of the disk are either de-coupled or gas and dust do not evolve co-spatially. An interesting conclusion is that the depletion in surface density in the gas at 4 AU is only a factor ~30, while the dust is depleted by a factor ~3000 with respect to the outer disk. It could thus mean that dust is much more evolved inside 4 AU than the gas.
7. Conclusion
We report here the first detection of the far-IR p-H2O line at 89.99 μm in the disk around TW Hya from recent observations with the Herschel/PACS instrument in the framework of the open time key program GASPS. In addition, the CO J = 18−17 line at 144.78 μm is detected. Many previous studies aimed at deriving disk geometry, structure, extent and dust content for TW Hya by “fitting” dust SEDs, images and gas emission lines simultaneously leading to sometimes different disk structures/masses. Before distinguishing between these models, a careful study of the robustness of a set of used line diagnostics is needed.
This paper systematically investigated the robustness of the disk chemistry and line emission from uncertainties in underlying physical/chemical processes and numerical methods besides the usual disk structure/extent/geometry. We adopt a fixed disk structure and a limited set of IR and submm lines from O, C+, OH, CO, CH+, H2O, HCO+ and HCN.
The water lines from the disk studied here are sensitive to those often “hidden” processes and model ingredients. The gas temperature (Tgas = Tdust), ice formation, surface chemistry, photo-desorption yields, metal abundances can affect water line fluxes by a factor of a few. In addition, details of the radiative transfer method and uncertain hydrogen collision cross sections can affect the low excitation water lines by a similar factor. Experimental and/or theoretical collision rates for H2O with atomic hydrogen are needed for ro-vibrational levels in order to diminish some of the uncertainties.
The stability of the CO, HCN and HCO+ lines – originating from the cold gas in the outer disk – studied here against uncertainties in the intrinsic physical and chemical parameters such as grain surface chemistry, ice formation, and desorption yields, confirms the robust diagnostic power of these lines also for protoplanetary disk research.
The TW Hya observations listed above – especially the new PACS high excitation line detections – are consistent within a factor two with a disk model in which gas and dust are well mixed and which has a gas-to-dust mass ratio of ~1 in the outer disk (beyond 4 AU) and a higher gas-to-dust mass ratio of ~100 in the optically thin inner disk.
Online material
Appendix A: Atomic and molecular data
The level populations required for the line radiative transfer are calculated from statistical equilibrium and escape probability (see Woitke et al. 2009a, for details). Table A.1 summarizes the number of levels, lines and collision partners employed for each atom, ion and molecule and also provides the respective references for the collision cross sections. The data itself was taken from the LAMDA database (Schöier et al. 2005) for all of them except water, which is discussed in more detail in the following paragraph.
Computed collision rates with p-H2 and o-H2 between rotational
levels of water are taken from Daniel et al.
(2011, 2010) and Dubernet et al. (2009, 2006).
Collision rates with He from Green (1980) are
taken into account. The ro-vibrational level energies and transition frequencies for the
441 lowest ortho-water levels and 413 lowest para-water levels
(Eup < 5000 cm-1) are drawn from the work
of Tennyson et al. (2001) and Barber et al. (2006). The collision rates with
H2 and electrons for the ro-vibrational levels and covering temperatures
between 200 and 500 K were computed by Faure &
Josselin (2008). We extrapolated those rates down to 10 K assuming the rate at
200 K for the collisions with electrons. In the absence of any other data, the collision
rates with atomic hydrogen are scaled by a factor
 from the collision rates with
H2.
from the collision rates with
H2.
Non-LTE model atoms, ions and molecules.
Appendix B: Metal abundances
HCO+ is a molecule that is known to be very sensitive to the ionization in
the disk surface, especially the electron abundance (Qi
et al. 2003). It is formed in the outer disk surface through ion-molecule
reactions such as H + CO, CO+ + H2 and
predominately destroyed by electronic recombination. This is essentially PDR chemistry
and can be well understood using the standard PDR parameter
χ/n⟨ H ⟩. The HCO+ abundance
peaks in a thin surface layer at a χ/n⟨ H ⟩
of 10-4, where the total hydrogen number densities are of the order of
~107 cm-3 (Fig. 2).
The thickness of this HCO+ layer increases if ionizing radiation can
penetrate deeper, e.g. in the case of X-rays and/or if self-shielding is switched off.
Van Zadelhoff et al. (2003) showed the
differences in the thickness of the layer due to different radiative transfer methods
and stellar input spectra. However, the effect on the HCO+ line fluxes was of
the order of 30% or less.
The HCO+ 4−3 line flux as measured by Thi et al. (2004) is 0.272 × 10⁻¹⁸ W/m2, which is roughly two orders or magnitude above our predicted flux from the standard model (low ISM abundances from Table 2). Hence, in Table B.1 we carefully revisited several recombination rates from the recent literature and the overall metal abundance.
New rate coefficients for HCO+ chemistry using the standard UMIST rate parametrization.
The low metal abundances from Table 2 are still high enough (electron donors are mostly the metals) to provide electron abundances of 10-5 below χ/n⟨ H ⟩ of 10-4. This makes electronic recombination very efficient and destroys HCO+ in those layers. Changing to the new rates presented in Table B.1 does not affect the thickness of the HCO+ layer significantly. For all the other tests carried out in this paper, we thus stick to the standard UMIST rates.
The H recombination rate is still disputed
(e.g. McCall 2006). We use in this study the
UMIST rates for the reactions H + e− → H2 + H
(k1) or → 3 H (k2)
 (B.1)where T is the gas
temperature in K. Lowering the H recombination rate by a factor 10 has no
significant impact on the HCO+ abundance.
(B.1)where T is the gas
temperature in K. Lowering the H recombination rate by a factor 10 has no
significant impact on the HCO+ abundance.
Appendix C: Water formation on grain surfaces
The model used here for the formation of water on grain surfaces is based on the one described by Hollenbach et al. (2009). The network captures only the Eley-Rideal mechanism of prompt reaction with a gas phase H atom. In addition, water desorption can occur either intact or in the form of OH + H.
Fogel et al. (2011) report that they included
this surface formation channel of water into their chemical network. The reactions
 which are reported as their Eqs. (16) and
(17) most likely play a very minor role. Unless the environment is highly molecular (all
H in the form of H2), any H adsorbed to the surface (H#) will have a much
larger chance to encounter another H atom impinging from the gas phase before it
encounters an O or OH impinging from the gas phase. These reactions are also not
included in the reaction network suggested by Hollenbach
et al. (2009). We here strictly follow the latter reaction network and include
in two steps the formation and desorption of O and OH ice and then the surface reaction
of O and OH ice with impinging H-atoms (Eley-Rideal mechanism). The formation of water
ice and its thermal desorption, desorption through cosmic rays and photodesorption were
already included before (see Woitke et al.
2009a).
which are reported as their Eqs. (16) and
(17) most likely play a very minor role. Unless the environment is highly molecular (all
H in the form of H2), any H adsorbed to the surface (H#) will have a much
larger chance to encounter another H atom impinging from the gas phase before it
encounters an O or OH impinging from the gas phase. These reactions are also not
included in the reaction network suggested by Hollenbach
et al. (2009). We here strictly follow the latter reaction network and include
in two steps the formation and desorption of O and OH ice and then the surface reaction
of O and OH ice with impinging H-atoms (Eley-Rideal mechanism). The formation of water
ice and its thermal desorption, desorption through cosmic rays and photodesorption were
already included before (see Woitke et al.
2009a).
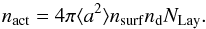
For a direct reaction of a surface species i with an impinging
atom/molecule j from the gas phase, the reaction rate can be written as
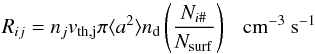 (C.3)where the last term in brackets denotes the
covering fraction for a single grain. a is here the radius of the dust
grain, nd the density of dust grains,
Ni# the total number of ice particles
of species i and Nsurf the total number of
surface sites on a single grain. To rewrite this in terms of volume densities (as used
in ProDiMo), the latter two can be calculated from the number
density of ice species i,
ni# and the number of surface sites per
surface area on a grain nsurf [cm-2]
(C.3)where the last term in brackets denotes the
covering fraction for a single grain. a is here the radius of the dust
grain, nd the density of dust grains,
Ni# the total number of ice particles
of species i and Nsurf the total number of
surface sites on a single grain. To rewrite this in terms of volume densities (as used
in ProDiMo), the latter two can be calculated from the number
density of ice species i,
ni# and the number of surface sites per
surface area on a grain nsurf [cm-2]
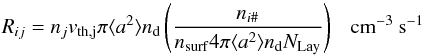 (C.4)where NLay is
the number of active layers on a grain surface. The thermal velocity
vth,j of a species j
is calculated as
(C.4)where NLay is
the number of active layers on a grain surface. The thermal velocity
vth,j of a species j
is calculated as 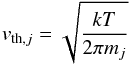 (C.5)where
mj is the mass of the species
j. We need to take into account that the number of surface ice layers
taking part in the chemistry is limited. The total density of surface species is
calculated as
(C.5)where
mj is the mass of the species
j. We need to take into account that the number of surface ice layers
taking part in the chemistry is limited. The total density of surface species is
calculated as 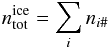 (C.6)and the number density of active surface
sites nact is defined as
(C.6)and the number density of active surface
sites nact is defined as
 (C.7)The total reaction rate is then given by
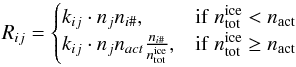 (C.8)where the rate coefficient
kij is given as
(C.8)where the rate coefficient
kij is given as
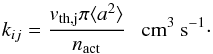 (C.9)The reaction rates for the two surface
reactions
(C.9)The reaction rates for the two surface
reactions 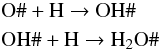 (C.10)are calculated from Eq. (C.8). In fact by assuming the simple
geometric cross section, we most likely maximize the reaction rate.
(C.10)are calculated from Eq. (C.8). In fact by assuming the simple
geometric cross section, we most likely maximize the reaction rate.
Another change to the water chemistry, if surface reactions are included, is that we allow for two reaction channels for water photodesorption, (a) H2O# + hν → H2O and (b) H2O# + hν → OH + H. The yields for the two reactions are taken from Hollenbach et al. (2009), 10-3 and 2 × 10⁻³ respectively. The adsorption energy is assumed to be 4800 K. Thermal as well as cosmic ray desorption are still assumed to desorb the water molecule as a whole.
Appendix D: Line fluxes from model series
Tables D.2 and D.3 list the modeled emission line fluxes for the entire series of 14 models described in Table 4. The following two subsections discuss a number of key diagnostics in addition to water: the fine structure lines and a series of submm lines.
Appendix D.1: Fine structure lines
Grain surface chemistry does not affect the fine structure line fluxes. Figure D.1 illustrates that the model with Tgas = Tdust has the largest impact on the fine structure lines of oxygen and carbon; the [O i] 63 μm line is a factor 6.3 weaker than the standard model. The change in line flux caused by introducing O ice or switching off the self-shielding is below 20%. Taking into account X-rays at the level observed for TW Hya, LX = 1.3 × 1030 erg/s, increases the [O i] line fluxes by only 5%.
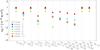 |
Fig. D.1 Sensitivity of the fine structure lines, CH+ lines, CO high J rotational lines and OH hyperfine structure lines in the model series without grain surface chemistry. |
For a high C/O ratio of 1.86, the [O i] 63 and 145 μm fine structure line fluxes are lower by a factor ~1.6 and 1.9 respectively (compared to the “standard” model). The [OI] 63 μm line changes from being optically thick in the standard model to being thin in the model with lower oxygen abundance. This explains why both lines do not change by the same factor.
Appendix D.2: Submm lines of CO, HCO+ and HCN
The observed 12CO/13CO line ratio is ~10, smaller than the expected optically thin value of 69 (isotopologue ratio Wilson 1999). In our “standard” model, the line ratio is ~4. If the gas mass were higher, the 13CO line would become optically thick as well, thus moving the line ratio to even smaller values (see Thi et al. 2010a). Since both lines are highly optically thick at disk gas masses above Mgas = 3 × 10⁻³M⊙, different photodissociation rates for 13CO will not change the main conclusion.
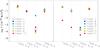 |
Fig. D.2 Sensitivity of the submm lines from the outer disk in the model series without grain surface chemistry (left) and with grain surface chemistry (right). |
The HCN fluxes from the model do not change by more than 50% throughout the series of models presented in this work. Even when changing the C/O ratio to 1.86, the HCN rotational line fluxes increase only by a factor 1.5.
Also, the CO submm line fluxes are very stable (within 0.3 dex). The only process impacting those lines is the lack of photodesorption. In that case, all oxygen remains in the form of water ice on the grains, thus preventing the formation of CO in the gas phase.
HCO+ is the most sensitive line in our study. Its flux reacts to the
presence of X-rays because the H abundances increase. The line forms in
the upper disk, where the assumption
Tgas = Tdust is not valid;
assuming the lower dust temperature for the gas produces a lower HCO+ line
flux. Since the line originates in a layer with fairly high density
(n⟨ H ⟩ ~ 107 cm-3), the line
is close to LTE. The strongest impact occurs for a changing metallicity. If the metal
abundance is lowered with respect to the standard model by two/three orders of
magnitude (S, Na, Mg, Si, Fe, and PAH abundance), the model HCO+ line flux
becomes 5.66 × 10⁻²¹/1.88 × 10-20 W/m2. The thickness
of the HCO+ layer grows because of the lower electron abundance, thus
building up higher column densities. Table D.1
shows that the [Fe ii] 25.99 μm line is anticorrelated with
the HCO+ line. When the metallicity changes by 3 dex, the HCO+
line becomes a factor 116 stronger, while the iron fine structure line decreases by a
factor 1000. On the other hand, HCN line fluxes are not affected
and the water line fluxes and [O i] line flux do not change by more than 3%. The TW Hya upper limit reported from Spitzer/IRS spectra for the [Fe ii] 25.99 μm line (Carr, priv. comm.) is ~10-17 W/m2, but the presence of additional spectral features makes this estimate rather difficult. At this level, the Spitzer upper limit on [Fe ii] is less stringent in fixing the metal/electron abundance than the HCO+ line. Semenov & Wiebe (2011) modeled a disk with strong turbulent diffusion (a diffusion coefficient of ~1018 cm2/s in the outer disk regions) and show that the mixing can enhance the HCO+ abundance in the thin surface layers by up to two orders of magnitude.
Line fluxes [10-18 W/m2] as a function of metallicity.
This model series confirms once more the robust diagnostic of the standard submm lines (CO, HCN) for deriving the physics/geometry of the outer regions of protoplanetary disks. This is partly due to the relatively simple chemistry, but also due to simpler line radiative transfer (LTE). Similar studies are required to identify robust tracers for the inner disk structure such as the CO ro-vibrational lines.
Model series without grain surface reactions: line fluxes are in 10-18 W/m2.
Model series with grain surface reactions: line fluxes are in 10-18 W/m2.
The water abundance is defined as ϵH2O = n(H2O)/n⟨ H ⟩, with n⟨ H ⟩ being the total hydrogen number density n(H) + 2n(H2).
Recent modeling of the photo evaporative wind shows that the VLA data could partially originate from free-free emission (Pascucci et al. 2012).
The average gas temperature for water is defined as
 , with n being the density
and m the mass of water. M(H2O) is the total
mass of water in the disk model and dV,r,z are the volume element and the
radial and vertical coordinate.
, with n being the density
and m the mass of water. M(H2O) is the total
mass of water in the disk model and dV,r,z are the volume element and the
radial and vertical coordinate.
Acknowledgments
G.M. is supported by Ramon y Cajal grant RYC-2011-07920. I.K. acknowledges funding by an NWO MEERVOUD grant. W.F.T., P.W. and I.K. acknowledge funding from the EU FP7-2011 under Grant Agreement No. 284405. C.P. acknowledges funding from the European Commission’s 7th Framework Program (contract PERG06-GA-2009-256513) and from Agence Nationale pour la Recherche (ANR) of France under contract ANR-2010-JCJC-0504-01. Part of the computations presented in this paper were performed at the Service Commun de Calcul Intensif de l’Observatoire de Grenoble (SCCI) on the super-computer funded by Agence Nationale pour la Recherche under contracts ANR-07-BLAN-0221, ANR-2010-JCJC-0504-01 and ANR-2010-JCJC-0501-01.
References
- Abouaf-Marguin, L., Vasserot, A.-M., Pardanaud, C., & Michaut, X. 2009, Chem. Phys. Lett., 480, 82 [NASA ADS] [CrossRef] [Google Scholar]
- Abrahamsson, E., Krems, R. V., & Dalgarno, A. 2007, ApJ, 654, 1171 [NASA ADS] [CrossRef] [Google Scholar]
- Adamson, J., Farhat, S., Morter, C., et al. 1994, J. Chem. Phys., 98, 5665 [Google Scholar]
- Aikawa, Y., & Herbst, E. 2001, A&A, 371, 1107 [NASA ADS] [CrossRef] [EDP Sciences] [Google Scholar]
- Aikawa, Y., Miyama, S. M., Nakano, T., & Umebayashi, T. 1996, ApJ, 467, 684 [NASA ADS] [CrossRef] [Google Scholar]
- Anders, E., & Grevesse, N. 1989, Geochim. Cosmochim. Acta, 53, 197 [Google Scholar]
- Andersson, S., & van Dishoeck, E. F. 2008, A&A, 491, 907 [NASA ADS] [CrossRef] [EDP Sciences] [Google Scholar]
- Arasa, C., Andersson, S., Cuppen, H., van Dishoeck, E., & Kroes, G. 2010, J. Chem. Phys., 132, 184510 [NASA ADS] [CrossRef] [Google Scholar]
- Aresu, G., Kamp, I., Meijerink, R., et al. 2011, A&A, 526, A163 [NASA ADS] [CrossRef] [EDP Sciences] [Google Scholar]
- Aresu, G., Meijerink, R., Kamp, I., et al. 2012, A&A, 547, A69 [NASA ADS] [CrossRef] [EDP Sciences] [Google Scholar]
- Balakrishnan, N., Yan, M., & Dalgarno, A. 2002, ApJ, 568, 443 [NASA ADS] [CrossRef] [Google Scholar]
- Barber, R. J., Tennyson, J., Harris, G. J., & Tolchenov, R. N. 2006, MNRAS, 368, 1087 [NASA ADS] [CrossRef] [Google Scholar]
- Barrado, Y, Navascués, D. 2006, A&A, 459, 511 [NASA ADS] [CrossRef] [EDP Sciences] [Google Scholar]
- Bell, K. L., Berrington, K. A., & Thomas, M. R. J. 1998, MNRAS, 293, L83 [NASA ADS] [CrossRef] [Google Scholar]
- Bergin, E., Calvet, N., D’Alessio, P., & Herczeg, G. J. 2003, ApJ, 591, L159 [NASA ADS] [CrossRef] [Google Scholar]
- Bergin, E. A., Cleeves, L. I., Gorti, U., et al. 2013, Nature, 493, 644 [NASA ADS] [CrossRef] [PubMed] [Google Scholar]
- Bethell, T., & Bergin, E. 2009, Science, 326, 1675 [NASA ADS] [CrossRef] [Google Scholar]
- Bockelée-Morvan, D. 2010, in EAS Publ. Ser. 41, eds. T. Montmerle, D. Ehrenreich, & A.-M. Lagrange, 313 [Google Scholar]
- Buntkowsky, G., Limbach, H.-H., Walaszek, B., et al. 2008, Z. Phys. Chem., 222, 1049 [CrossRef] [Google Scholar]
- Carr, J. S., & Najita, J. R. 2008, Science, 319, 1504 [NASA ADS] [CrossRef] [PubMed] [Google Scholar]
- Ceccarelli, C., Dominik, C., Caux, E., Lefloch, B., & Caselli, P. 2005, ApJ, 631, L81 [NASA ADS] [CrossRef] [Google Scholar]
- Cecchi-Pestellini, C., Bodo, E., Balakrishnan, N., & Dalgarno, A. 2002, ApJ, 571, 1015 [NASA ADS] [CrossRef] [Google Scholar]
- Chaparro Molano, G., & Kamp, I. 2012, A&A, 537, A138 [NASA ADS] [CrossRef] [EDP Sciences] [Google Scholar]
- Chapillon, E., Parise, B., Guilloteau, S., Dutrey, A., & Wakelam, V. 2010, A&A, 520, A61 [NASA ADS] [CrossRef] [EDP Sciences] [Google Scholar]
- Ciesla, F. J., & Cuzzi, J. N. 2006, Icarus, 181, 178 [NASA ADS] [CrossRef] [Google Scholar]
- Daniel, F., Dubernet, M.-L., Pacaud, F., & Grosjean, A. 2010, A&A, 517, A13 [NASA ADS] [CrossRef] [EDP Sciences] [Google Scholar]
- Daniel, F., Dubernet, M.-L., & Grosjean, A. 2011, A&A, 536, A76 [NASA ADS] [CrossRef] [EDP Sciences] [Google Scholar]
- Daniel, F., Goicoechea, J., Cernicharo, J., Dubernet, M.-L., & Faure, A. 2012, A&A, 547, A81 [NASA ADS] [CrossRef] [EDP Sciences] [Google Scholar]
- Dent, W. R. F., Thi, W. F., Kamp, I., et al. 2013, PASP, 125, 477 [NASA ADS] [CrossRef] [Google Scholar]
- Dominik, C., Ceccarelli, C., Hollenbach, D., & Kaufman, M. 2005, ApJ, 635, L85 [NASA ADS] [CrossRef] [Google Scholar]
- Dubernet, M.-L., Daniel, F., Grosjean, A., et al. 2006, A&A, 460, 323 [NASA ADS] [CrossRef] [EDP Sciences] [Google Scholar]
- Dubernet, M.-L., Daniel, F., Grosjean, A., & Lin, C. Y. 2009, A&A, 497, 911 [NASA ADS] [CrossRef] [EDP Sciences] [Google Scholar]
- Faure, A., & Josselin, E. 2008, A&A, 492, 257 [NASA ADS] [CrossRef] [EDP Sciences] [Google Scholar]
- Flower, D. R. 1999, MNRAS, 305, 651 [NASA ADS] [CrossRef] [Google Scholar]
- Fogel, J. K. J., Bethell, T. J., Bergin, E. A., Calvet, N., & Semenov, D. 2011, ApJ, 726, 29 [NASA ADS] [CrossRef] [Google Scholar]
- Fraser, H. J., Collings, M. P., McCoustra, M. R. S., & Williams, D. A. 2001, MNRAS, 327, 1165 [NASA ADS] [CrossRef] [Google Scholar]
- Glassgold, A. E., Meijerink, R., & Najita, J. R. 2009, ApJ, 701, 142 [NASA ADS] [CrossRef] [Google Scholar]
- Gorti, U., Hollenbach, D., Najita, J., & Pascucci, I. 2011, ApJ, 735, 90 [NASA ADS] [CrossRef] [Google Scholar]
- Green, S. 1980, ApJS, 42, 103 [NASA ADS] [CrossRef] [Google Scholar]
- Güdel, M., Briggs, K. R., Arzner, K., et al. 2007, A&A, 468, 353 [NASA ADS] [CrossRef] [EDP Sciences] [Google Scholar]
- Hama, T., Watanabe, N., Kouchi, A., & Yokoyama, M. 2011, ApJ, 738, L15 [Google Scholar]
- Hammami, K., Owono Owono, L. C., & Stäuber, P. 2009, A&A, 507, 1083 [NASA ADS] [CrossRef] [EDP Sciences] [Google Scholar]
- Hogerheijde, M. R., Bergin, E. A., Brinch, C., et al. 2011, Science, 334, 338 [NASA ADS] [CrossRef] [PubMed] [Google Scholar]
- Hollenbach, D., Kaufman, M. J., Bergin, E. A., & Melnick, G. J. 2009, ApJ, 690, 1497 [CrossRef] [Google Scholar]
- Jaquet, R., Staemmler, V., Smith, M. D., & Flower, D. R. 1992, J. Phys. B Atom. Mol. Phys., 25, 285 [Google Scholar]
- Jenkins, E. B. 2009, ApJ, 700, 1299 [NASA ADS] [CrossRef] [Google Scholar]
- Kamp, I., Tilling, I., Woitke, P., Thi, W., & Hogerheijde, M. 2010, A&A, 510, A18 [NASA ADS] [CrossRef] [EDP Sciences] [Google Scholar]
- Kastner, J. H., Zuckerman, B., Weintraub, D. A., & Forveille, T. 1997, Science, 277, 67 [NASA ADS] [CrossRef] [PubMed] [Google Scholar]
- Kastner, J. H., Huenemoerder, D. P., Schulz, N. S., Canizares, C. R., & Weintraub, D. A. 2002, ApJ, 567, 434 [NASA ADS] [CrossRef] [Google Scholar]
- Klippenstein, S. J., Georgievskii, Y., & McCall, B. J. 2010, J. Phys. Chem. A, 114, 278 [CrossRef] [Google Scholar]
- Korolov, I., Plasil, R., Kotrik, T., Dohnal, P., & Glosik, J. 2009, Int. J. Mass Spectrom., 280, 144 [NASA ADS] [CrossRef] [Google Scholar]
- Lim, A. J., Rabadán, I., & Tennyson, J. 1999, MNRAS, 306, 473 [NASA ADS] [CrossRef] [Google Scholar]
- Mamajek, E. E. 2005, ApJ, 634, 1385 [NASA ADS] [CrossRef] [Google Scholar]
- McCall, B. J. 2006, Roy. Soc. London Phil. Trans. Ser. A, 364, 2953 [NASA ADS] [CrossRef] [Google Scholar]
- Meeus, G., Pinte, C., Woitke, P., et al. 2010, A&A, 518, L124 [NASA ADS] [CrossRef] [EDP Sciences] [Google Scholar]
- Meijerink, R., Aresu, G., Kamp, I., et al. 2012, A&A, 547, A68 [NASA ADS] [CrossRef] [EDP Sciences] [Google Scholar]
- Najita, J. R., Carr, J. S., Strom, S. E., et al. 2010, ApJ, 712, 274 [NASA ADS] [CrossRef] [Google Scholar]
- Najita, J. R., Ádámkovics, M., & Glassgold, A. E. 2011, ApJ, 743, 147 [NASA ADS] [CrossRef] [Google Scholar]
- Öberg, K. I., Linnartz, H., Visser, R., & van Dishoeck, E. F. 2009, ApJ, 693, 1209 [NASA ADS] [CrossRef] [Google Scholar]
- Offer, A., van Hemert, M., & van Dishoeck, E. 1994, J. Chem. Phys., 100, 362 [NASA ADS] [CrossRef] [Google Scholar]
- Ott, S. 2010, in Astronomical Data Analysis Software and Systems XIX, eds. Y. Mizumoto, K.-I. Morita, & M. Ohishi, ASP Conf. Ser., 434, 139 [Google Scholar]
- Pascucci, I., Sterzik, M., Alexander, R. D., et al. 2011, ApJ, 736, 13 [NASA ADS] [CrossRef] [Google Scholar]
- Pascucci, I., Gorti, U., & Hollenbach, D. 2012, ApJ, 751, L42 [NASA ADS] [CrossRef] [Google Scholar]
- Pinte, C., Ménard, F., Duchêne, G., & Bastien, P. 2006, A&A, 459, 797 [NASA ADS] [CrossRef] [EDP Sciences] [Google Scholar]
- Pinte, C., Harries, T. J., Min, M., et al. 2009, A&A, 498, 967 [NASA ADS] [CrossRef] [EDP Sciences] [Google Scholar]
- Poelman, D. R., Spaans, M., & Tielens, A. G. G. M. 2007, A&A, 464, 1023 [NASA ADS] [CrossRef] [EDP Sciences] [Google Scholar]
- Poglitsch, A., Waelkens, C., Geis, N., et al. 2010, A&A, 518, L2 [NASA ADS] [CrossRef] [EDP Sciences] [Google Scholar]
- Pontoppidan, K. M., Salyk, C., Blake, G. A., & Käufl, H. U. 2010a, ApJ, 722, L173 [NASA ADS] [CrossRef] [Google Scholar]
- Pontoppidan, K. M., Salyk, C., Blake, G. A., et al. 2010b, ApJ, 720, 887 [NASA ADS] [CrossRef] [Google Scholar]
- Qi, C., Kessler, J. E., Koerner, D. W., Sargent, A. I., & Blake, G. A. 2003, ApJ, 597, 986 [NASA ADS] [CrossRef] [Google Scholar]
- Qi, C., Wilner, D. J., Calvet, N., et al. 2006, ApJ, 636, L157 [NASA ADS] [CrossRef] [Google Scholar]
- Riviere-Marichalar, P., Ménard, F., Thi, W. F., et al. 2012, A&A, 538, L3 [NASA ADS] [CrossRef] [EDP Sciences] [Google Scholar]
- Salyk, C., Blake, G. A., Boogert, A. C. A., & Brown, J. M. 2007, ApJ, 655, L105 [NASA ADS] [CrossRef] [Google Scholar]
- Salyk, C., Pontoppidan, K. M., Blake, G. A., et al. 2008, ApJ, 676, L49 [NASA ADS] [CrossRef] [Google Scholar]
- Schöier, F. L., van der Tak, F. F. S., van Dishoeck, E. F., & Black, J. H. 2005, A&A, 432, 369 [NASA ADS] [CrossRef] [EDP Sciences] [Google Scholar]
- Semenov, D., & Wiebe, D. 2011, ApJS, 196, 25 [NASA ADS] [CrossRef] [Google Scholar]
- Szulágyi, J., Pascucci, I., Ábrahám, P., et al. 2012, ApJ, 759, 47 [NASA ADS] [CrossRef] [Google Scholar]
- Tennyson, J., Zobov, N. F., Williamson, R., Polyansky, O. L., & Bernath, P. F. 2001, J. Phys. Chem. Ref. Data, 30, 735 [NASA ADS] [CrossRef] [Google Scholar]
- Thi, W.-F., van Zadelhoff, G.-J., & van Dishoeck, E. F. 2004, A&A, 425, 955 [NASA ADS] [CrossRef] [EDP Sciences] [Google Scholar]
- Thi, W.-F., Mathews, G., Ménard, F., et al. 2010a, A&A, 518, L125 [NASA ADS] [CrossRef] [EDP Sciences] [Google Scholar]
- Thi, W.-F., Woitke, P., & Kamp, I. 2010b, MNRAS, 407, 232 [NASA ADS] [CrossRef] [Google Scholar]
- Thi, W.-F., Ménard, F., Meeus, G., et al. 2011a, A&A, 530, L2 [NASA ADS] [CrossRef] [EDP Sciences] [Google Scholar]
- Thi, W.-F., Woitke, P., & Kamp, I. 2011b, MNRAS, 412, 711 [NASA ADS] [Google Scholar]
- Tilling, I., Woitke, P., Meeus, G., et al. 2012, A&A, 538, A20 [NASA ADS] [CrossRef] [EDP Sciences] [Google Scholar]
- Turpin, F., Stoecklin, T., & Voronin, A. 2010, A&A, 511, A28 [NASA ADS] [CrossRef] [EDP Sciences] [Google Scholar]
- Vacca, W. D., & Sandell, G. 2011, ApJ, 732, 8 [NASA ADS] [CrossRef] [Google Scholar]
- van Dishoeck, E. F., Kristensen, L. E., Benz, A. O., et al. 2011, PASP, 123, 138 [NASA ADS] [CrossRef] [Google Scholar]
- Van Zadelhoff, G.-J., Aikawa, Y., Hogerheijde, M. R., & van Dishoeck, E. F. 2003, A&A, 397, 789 [NASA ADS] [CrossRef] [EDP Sciences] [Google Scholar]
- Westley, M. S., Baragiola, R. A., Johnson, R. E., & Baratta, G. A. 1995, Nature, 373, 405 [NASA ADS] [CrossRef] [PubMed] [Google Scholar]
- Wilner, D. J., Ho, P. T. P., Kastner, J. H., & Rodríguez, L. F. 2000, ApJ, 534, L101 [NASA ADS] [CrossRef] [PubMed] [Google Scholar]
- Wilson, T. L. 1999, Rep. Prog. Phys., 62, 143 [Google Scholar]
- Wilson, N. J., & Bell, K. L. 2002, MNRAS, 337, 1027 [NASA ADS] [CrossRef] [Google Scholar]
- Woitke, P., Kamp, I., & Thi, W.-F. 2009a, A&A, 501, 383 [NASA ADS] [CrossRef] [EDP Sciences] [Google Scholar]
- Woitke, P., Thi, W.-F., Kamp, I., & Hogerheijde, M. R. 2009b, A&A, 501, L5 [NASA ADS] [CrossRef] [EDP Sciences] [Google Scholar]
- Woitke, P., Riaz, B., Duchêne, G., et al. 2011, A&A, 534, A44 [NASA ADS] [CrossRef] [EDP Sciences] [Google Scholar]
- Woodall, J., Agúndez, M., Markwick-Kemper, A. J., & Millar, T. J. 2007, A&A, 466, 1197 [NASA ADS] [CrossRef] [EDP Sciences] [Google Scholar]
- Yang, B., Stancil, P. C., Balakrishnan, N., & Forrey, R. C. 2010, ApJ, 718, 1062 [NASA ADS] [CrossRef] [Google Scholar]
- Zhang, K., Pontoppidan, K. M., Salyk, C., & Blake, G. A. 2013, ApJ, 766, 82 [NASA ADS] [CrossRef] [Google Scholar]
All Tables
Selected CO, water and H2 lines with their observed fluxes (Salyk et al. 2007; Najita et al. 2010; Zhang et al. 2013) in the near- and mid-IR wavelength range from the “standard model” (model 1) and the model with 100 times higher gas mass inside 4 AU (model 14).
Ortho/para water line ratios of lines that are close in excitation energy in the model series.
New rate coefficients for HCO+ chemistry using the standard UMIST rate parametrization.
All Figures
|
Fig. 1 Full set of TWHya PACS spectra obtained from the GASPS program including the deeper range scan. |
| In the text | |
|
Fig. 2 Basic plots for the standard disk model: (1) total hydrogen number density with red/black contours overlaid showing the radial/total extinction of 1; (2) gas temperature with contours overlaid for the gas temperature (white) and dust temperature (black); (3) OH abundance with the vertical extinction of 0.01 and 0.1 overlaid by blue contours and the PDR parameter log χ/n⟨ H ⟩ = −2, ... −6 overlaid by white contours; (4) CO abundances with gas temperature contours (white) and dust temperature contours (black); (5) water abundance with the total extinction AV = 1 overlaid in black and the gas temperature contours (white) and (6) HCO+ abundance. |
| In the text | |
|
Fig. 3 Primary and secondary formation and destruction rates for gas phase water in the “standard” disk model (grid resolution 100 × 70). The numbers listed for every second grid point refer to the reactions listed in Table 5. |
| In the text | |
|
Fig. 4 Water ortho/para ratio in the standard model. Black contours show o/p ratios of 0.5, 1, 1.5, 2, 2.5 and 3. White contours denote gas temperatures of 20 and 50 K. |
| In the text | |
|
Fig. 5 Water gas phase abundance in the TW Hya disk model (from top left to bottom right): standard model (model 1), with 1/1000 of the low ISM metallicity (model 3), C/O ratio of 1.86 (model 4), Tgas = Tdust (model 5), without water self shielding (model 6), water on surfaces (model 7), without water adsorption (model 9), with 100 times higher surface reaction rates (model 10), with two different desorption channels (model 11), with 10 active grain surface layers instead of 2 (model 12), without water photodesorption (the outer water reservoir is gone, model 13), and the standard model with a 100 times higher gas mass in the disk inside 4 AU (model 14). White dashed contours: gas temperatures of 200 and 2000 K. Red dashed contours: vertical AV. Black dashed contours: minimum of radial and vertical AV. |
| In the text | |
|
Fig. 5 Continued. Water gas phase abundance in the TW Hya disk model. Left: standard model with X-rays (model 2). Right: water on surfaces with X-rays (model 8). White dashed contours: gas temperatures of 200 and 2000 K. Black dashed contours: minimum of radial and vertical AV. |
| In the text | |
|
Fig. 6 Water ice abundance with surface reactions (left, model 7), with changed water desorption processes (middle, model 11) and without water adsorption from the gas phase (model 9) – all water ice being formed by surface reactions (right). The white contours denote dust temperatures of 20 and 50 K. |
| In the text | |
|
Fig. 7 Sensitivity of the water lines in the model series without grain surface chemistry (top) and with grain surface chemistry (bottom). |
| In the text | |
|
Fig. 8 TW Hya low-resolution IRS spectrum (red) scaled by a factor 0.85. Overplotted in black are the TW Hya models (“standard” model – solid line; model with Tgas = Tdust – dashed line; model with water formation on dust surfaces – dotted line, indistinguishable from solid line) convolved to give a resolution of 100. |
| In the text | |
|
Fig. 9 Percentage change in line fluxes for a series of water lines. The plus signs are a comparison between the fluxes from the “standard” model and the fluxes computed with MCFOST using the level populations of the “standard” model (large water molecule, 70 × 70). The asterisks are a comparison between the “standard” model with the new LAMDA file and the small water molecule and the MCFOST run. Note that MCFOST contains only H2 collisions. |
| In the text | |
|
Fig. 10 Percentage change in line fluxes for a series of water lines due to varying collision cross sections randomly within a factor 10. The symbols correspond to 10 different sets of collision cross sections. The labeling of the x-axis shows the excitation temperature of the upper level (top) and the line identification with wavelength (bottom). |
| In the text | |
|
Fig. 11 Left: optical depth, cumulative line fluxes and zone where the water 538.29 μm line originates in our “standard” model. The optical depth is obtained from vertical escape probability which is a good approximation in the case of the TW Hya disk which has a low inclination of 7°. The zone of line formation outlined by black dashed contours that denote where 15 to 85% of the flux build up vertically and radially; the black solid line encloses thus 50% of the total line emission. The blue contours show total hydrogen number densities of 107 and 108 cm-3. Right: density of the collision partners H, H2 and e− with the line forming region of the 538.29 μm line superimposed. |
| In the text | |
|
Fig. 12 Comparison between selected observed line fluxes and the standard model with two zones (inside 4 AU a gas-to-dust mass ratio of 0.01 and outside 1.0). HCO+ fluxes are from the model with a 1000 times lower metallicity. Observed fluxes are denoted by filled circles with 3σ error bars and model fluxes by diamonds. |
| In the text | |
|
Fig. D.1 Sensitivity of the fine structure lines, CH+ lines, CO high J rotational lines and OH hyperfine structure lines in the model series without grain surface chemistry. |
| In the text | |
|
Fig. D.2 Sensitivity of the submm lines from the outer disk in the model series without grain surface chemistry (left) and with grain surface chemistry (right). |
| In the text | |
Current usage metrics show cumulative count of Article Views (full-text article views including HTML views, PDF and ePub downloads, according to the available data) and Abstracts Views on Vision4Press platform.
Data correspond to usage on the plateform after 2015. The current usage metrics is available 48-96 hours after online publication and is updated daily on week days.
Initial download of the metrics may take a while.