Fig. 5
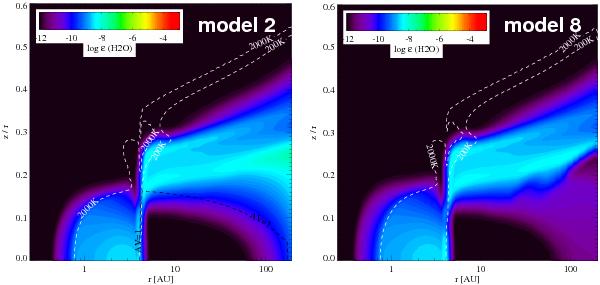
Continued. Water gas phase abundance in the TW Hya disk model. Left: standard model with X-rays (model 2). Right: water on surfaces with X-rays (model 8). White dashed contours: gas temperatures of 200 and 2000 K. Black dashed contours: minimum of radial and vertical AV.
Current usage metrics show cumulative count of Article Views (full-text article views including HTML views, PDF and ePub downloads, according to the available data) and Abstracts Views on Vision4Press platform.
Data correspond to usage on the plateform after 2015. The current usage metrics is available 48-96 hours after online publication and is updated daily on week days.
Initial download of the metrics may take a while.