| Issue |
A&A
Volume 559, November 2013
|
|
|---|---|---|
| Article Number | A24 | |
| Number of page(s) | 20 | |
| Section | Interstellar and circumstellar matter | |
| DOI | https://doi.org/10.1051/0004-6361/201220621 | |
| Published online | 30 October 2013 | |
Online material
Appendix A: Atomic and molecular data
The level populations required for the line radiative transfer are calculated from statistical equilibrium and escape probability (see Woitke et al. 2009a, for details). Table A.1 summarizes the number of levels, lines and collision partners employed for each atom, ion and molecule and also provides the respective references for the collision cross sections. The data itself was taken from the LAMDA database (Schöier et al. 2005) for all of them except water, which is discussed in more detail in the following paragraph.
Computed collision rates with p-H2 and o-H2 between rotational
levels of water are taken from Daniel et al.
(2011, 2010) and Dubernet et al. (2009, 2006).
Collision rates with He from Green (1980) are
taken into account. The ro-vibrational level energies and transition frequencies for the
441 lowest ortho-water levels and 413 lowest para-water levels
(Eup < 5000 cm-1) are drawn from the work
of Tennyson et al. (2001) and Barber et al. (2006). The collision rates with
H2 and electrons for the ro-vibrational levels and covering temperatures
between 200 and 500 K were computed by Faure &
Josselin (2008). We extrapolated those rates down to 10 K assuming the rate at
200 K for the collisions with electrons. In the absence of any other data, the collision
rates with atomic hydrogen are scaled by a factor
 from the collision rates with
H2.
from the collision rates with
H2.
Non-LTE model atoms, ions and molecules.
Appendix B: Metal abundances
HCO+ is a molecule that is known to be very sensitive to the ionization in
the disk surface, especially the electron abundance (Qi
et al. 2003). It is formed in the outer disk surface through ion-molecule
reactions such as H + CO, CO+ + H2 and
predominately destroyed by electronic recombination. This is essentially PDR chemistry
and can be well understood using the standard PDR parameter
χ/n⟨ H ⟩. The HCO+ abundance
peaks in a thin surface layer at a χ/n⟨ H ⟩
of 10-4, where the total hydrogen number densities are of the order of
~107 cm-3 (Fig. 2).
The thickness of this HCO+ layer increases if ionizing radiation can
penetrate deeper, e.g. in the case of X-rays and/or if self-shielding is switched off.
Van Zadelhoff et al. (2003) showed the
differences in the thickness of the layer due to different radiative transfer methods
and stellar input spectra. However, the effect on the HCO+ line fluxes was of
the order of 30% or less.
+ CO, CO+ + H2 and
predominately destroyed by electronic recombination. This is essentially PDR chemistry
and can be well understood using the standard PDR parameter
χ/n⟨ H ⟩. The HCO+ abundance
peaks in a thin surface layer at a χ/n⟨ H ⟩
of 10-4, where the total hydrogen number densities are of the order of
~107 cm-3 (Fig. 2).
The thickness of this HCO+ layer increases if ionizing radiation can
penetrate deeper, e.g. in the case of X-rays and/or if self-shielding is switched off.
Van Zadelhoff et al. (2003) showed the
differences in the thickness of the layer due to different radiative transfer methods
and stellar input spectra. However, the effect on the HCO+ line fluxes was of
the order of 30% or less.
The HCO+ 4−3 line flux as measured by Thi et al. (2004) is 0.272 × 10⁻¹⁸ W/m2, which is roughly two orders or magnitude above our predicted flux from the standard model (low ISM abundances from Table 2). Hence, in Table B.1 we carefully revisited several recombination rates from the recent literature and the overall metal abundance.
New rate coefficients for HCO+ chemistry using the standard UMIST rate parametrization.
The low metal abundances from Table 2 are still high enough (electron donors are mostly the metals) to provide electron abundances of 10-5 below χ/n⟨ H ⟩ of 10-4. This makes electronic recombination very efficient and destroys HCO+ in those layers. Changing to the new rates presented in Table B.1 does not affect the thickness of the HCO+ layer significantly. For all the other tests carried out in this paper, we thus stick to the standard UMIST rates.
The H recombination rate is still disputed
(e.g. McCall 2006). We use in this study the
UMIST rates for the reactions H + e− → H2 + H
(k1) or → 3 H (k2)
 (B.1)where T is the gas
temperature in K. Lowering the H recombination rate by a factor 10 has no
significant impact on the HCO+ abundance.
(B.1)where T is the gas
temperature in K. Lowering the H recombination rate by a factor 10 has no
significant impact on the HCO+ abundance.
Appendix C: Water formation on grain surfaces
The model used here for the formation of water on grain surfaces is based on the one described by Hollenbach et al. (2009). The network captures only the Eley-Rideal mechanism of prompt reaction with a gas phase H atom. In addition, water desorption can occur either intact or in the form of OH + H.
Fogel et al. (2011) report that they included
this surface formation channel of water into their chemical network. The reactions
 which are reported as their Eqs. (16) and
(17) most likely play a very minor role. Unless the environment is highly molecular (all
H in the form of H2), any H adsorbed to the surface (H#) will have a much
larger chance to encounter another H atom impinging from the gas phase before it
encounters an O or OH impinging from the gas phase. These reactions are also not
included in the reaction network suggested by Hollenbach
et al. (2009). We here strictly follow the latter reaction network and include
in two steps the formation and desorption of O and OH ice and then the surface reaction
of O and OH ice with impinging H-atoms (Eley-Rideal mechanism). The formation of water
ice and its thermal desorption, desorption through cosmic rays and photodesorption were
already included before (see Woitke et al.
2009a).
which are reported as their Eqs. (16) and
(17) most likely play a very minor role. Unless the environment is highly molecular (all
H in the form of H2), any H adsorbed to the surface (H#) will have a much
larger chance to encounter another H atom impinging from the gas phase before it
encounters an O or OH impinging from the gas phase. These reactions are also not
included in the reaction network suggested by Hollenbach
et al. (2009). We here strictly follow the latter reaction network and include
in two steps the formation and desorption of O and OH ice and then the surface reaction
of O and OH ice with impinging H-atoms (Eley-Rideal mechanism). The formation of water
ice and its thermal desorption, desorption through cosmic rays and photodesorption were
already included before (see Woitke et al.
2009a).
For a direct reaction of a surface species i with an impinging
atom/molecule j from the gas phase, the reaction rate can be written as
 (C.3)where the last term in brackets denotes the
covering fraction for a single grain. a is here the radius of the dust
grain, nd the density of dust grains,
Ni# the total number of ice particles
of species i and Nsurf the total number of
surface sites on a single grain. To rewrite this in terms of volume densities (as used
in ProDiMo), the latter two can be calculated from the number
density of ice species i,
ni# and the number of surface sites per
surface area on a grain nsurf [cm-2]
(C.3)where the last term in brackets denotes the
covering fraction for a single grain. a is here the radius of the dust
grain, nd the density of dust grains,
Ni# the total number of ice particles
of species i and Nsurf the total number of
surface sites on a single grain. To rewrite this in terms of volume densities (as used
in ProDiMo), the latter two can be calculated from the number
density of ice species i,
ni# and the number of surface sites per
surface area on a grain nsurf [cm-2]
 (C.4)where NLay is
the number of active layers on a grain surface. The thermal velocity
vth,j of a species j
is calculated as
(C.4)where NLay is
the number of active layers on a grain surface. The thermal velocity
vth,j of a species j
is calculated as  (C.5)where
mj is the mass of the species
j. We need to take into account that the number of surface ice layers
taking part in the chemistry is limited. The total density of surface species is
calculated as
(C.5)where
mj is the mass of the species
j. We need to take into account that the number of surface ice layers
taking part in the chemistry is limited. The total density of surface species is
calculated as  (C.6)and the number density of active surface
sites nact is defined as
(C.6)and the number density of active surface
sites nact is defined as
 (C.7)The total reaction rate is then given by
 (C.8)where the rate coefficient
kij is given as
(C.8)where the rate coefficient
kij is given as
 (C.9)The reaction rates for the two surface
reactions
(C.9)The reaction rates for the two surface
reactions  (C.10)are calculated from Eq. (C.8). In fact by assuming the simple
geometric cross section, we most likely maximize the reaction rate.
(C.10)are calculated from Eq. (C.8). In fact by assuming the simple
geometric cross section, we most likely maximize the reaction rate.
Another change to the water chemistry, if surface reactions are included, is that we allow for two reaction channels for water photodesorption, (a) H2O# + hν → H2O and (b) H2O# + hν → OH + H. The yields for the two reactions are taken from Hollenbach et al. (2009), 10-3 and 2 × 10⁻³ respectively. The adsorption energy is assumed to be 4800 K. Thermal as well as cosmic ray desorption are still assumed to desorb the water molecule as a whole.
Appendix D: Line fluxes from model series
Tables D.2 and D.3 list the modeled emission line fluxes for the entire series of 14 models described in Table 4. The following two subsections discuss a number of key diagnostics in addition to water: the fine structure lines and a series of submm lines.
Appendix D.1: Fine structure lines
Grain surface chemistry does not affect the fine structure line fluxes. Figure D.1 illustrates that the model with Tgas = Tdust has the largest impact on the fine structure lines of oxygen and carbon; the [O i] 63 μm line is a factor 6.3 weaker than the standard model. The change in line flux caused by introducing O ice or switching off the self-shielding is below 20%. Taking into account X-rays at the level observed for TW Hya, LX = 1.3 × 1030 erg/s, increases the [O i] line fluxes by only 5%.
 |
Fig. D.1
Sensitivity of the fine structure lines, CH+ lines, CO high J rotational lines and OH hyperfine structure lines in the model series without grain surface chemistry. |
| Open with DEXTER | |
For a high C/O ratio of 1.86, the [O i] 63 and 145 μm fine structure line fluxes are lower by a factor ~1.6 and 1.9 respectively (compared to the “standard” model). The [OI] 63 μm line changes from being optically thick in the standard model to being thin in the model with lower oxygen abundance. This explains why both lines do not change by the same factor.
Appendix D.2: Submm lines of CO, HCO+ and HCN
The observed 12CO/13CO line ratio is ~10, smaller than the expected optically thin value of 69 (isotopologue ratio Wilson 1999). In our “standard” model, the line ratio is ~4. If the gas mass were higher, the 13CO line would become optically thick as well, thus moving the line ratio to even smaller values (see Thi et al. 2010a). Since both lines are highly optically thick at disk gas masses above Mgas = 3 × 10⁻³M⊙, different photodissociation rates for 13CO will not change the main conclusion.
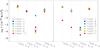 |
Fig. D.2
Sensitivity of the submm lines from the outer disk in the model series without grain surface chemistry (left) and with grain surface chemistry (right). |
| Open with DEXTER | |
The HCN fluxes from the model do not change by more than 50% throughout the series of models presented in this work. Even when changing the C/O ratio to 1.86, the HCN rotational line fluxes increase only by a factor 1.5.
Also, the CO submm line fluxes are very stable (within 0.3 dex). The only process impacting those lines is the lack of photodesorption. In that case, all oxygen remains in the form of water ice on the grains, thus preventing the formation of CO in the gas phase.
HCO+ is the most sensitive line in our study. Its flux reacts to the
presence of X-rays because the H abundances increase. The line forms in
the upper disk, where the assumption
Tgas = Tdust is not valid;
assuming the lower dust temperature for the gas produces a lower HCO+ line
flux. Since the line originates in a layer with fairly high density
(n⟨ H ⟩ ~ 107 cm-3), the line
is close to LTE. The strongest impact occurs for a changing metallicity. If the metal
abundance is lowered with respect to the standard model by two/three orders of
magnitude (S, Na, Mg, Si, Fe, and PAH abundance), the model HCO+ line flux
becomes 5.66 × 10⁻²¹/1.88 × 10-20 W/m2. The thickness
of the HCO+ layer grows because of the lower electron abundance, thus
building up higher column densities. Table D.1
shows that the [Fe ii] 25.99 μm line is anticorrelated with
the HCO+ line. When the metallicity changes by 3 dex, the HCO+
line becomes a factor 116 stronger, while the iron fine structure line decreases by a
factor 1000. On the other hand, HCN line fluxes are not affected
and the water line fluxes and [O i] line flux do not change by more than 3%. The TW Hya upper limit reported from Spitzer/IRS spectra for the [Fe ii] 25.99 μm line (Carr, priv. comm.) is ~10-17 W/m2, but the presence of additional spectral features makes this estimate rather difficult. At this level, the Spitzer upper limit on [Fe ii] is less stringent in fixing the metal/electron abundance than the HCO+ line. Semenov & Wiebe (2011) modeled a disk with strong turbulent diffusion (a diffusion coefficient of ~1018 cm2/s in the outer disk regions) and show that the mixing can enhance the HCO+ abundance in the thin surface layers by up to two orders of magnitude.
Line fluxes [10-18 W/m2] as a function of metallicity.
This model series confirms once more the robust diagnostic of the standard submm lines (CO, HCN) for deriving the physics/geometry of the outer regions of protoplanetary disks. This is partly due to the relatively simple chemistry, but also due to simpler line radiative transfer (LTE). Similar studies are required to identify robust tracers for the inner disk structure such as the CO ro-vibrational lines.
Model series without grain surface reactions: line fluxes are in 10-18 W/m2.
Model series with grain surface reactions: line fluxes are in 10-18 W/m2.
© ESO, 2013
Current usage metrics show cumulative count of Article Views (full-text article views including HTML views, PDF and ePub downloads, according to the available data) and Abstracts Views on Vision4Press platform.
Data correspond to usage on the plateform after 2015. The current usage metrics is available 48-96 hours after online publication and is updated daily on week days.
Initial download of the metrics may take a while.