Fig. 9
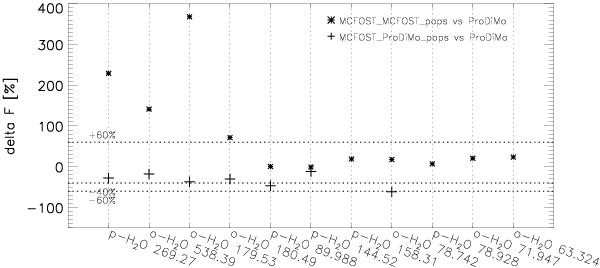
Percentage change in line fluxes for a series of water lines. The plus signs are a comparison between the fluxes from the “standard” model and the fluxes computed with MCFOST using the level populations of the “standard” model (large water molecule, 70 × 70). The asterisks are a comparison between the “standard” model with the new LAMDA file and the small water molecule and the MCFOST run. Note that MCFOST contains only H2 collisions.
Current usage metrics show cumulative count of Article Views (full-text article views including HTML views, PDF and ePub downloads, according to the available data) and Abstracts Views on Vision4Press platform.
Data correspond to usage on the plateform after 2015. The current usage metrics is available 48-96 hours after online publication and is updated daily on week days.
Initial download of the metrics may take a while.