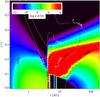
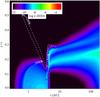
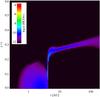
Fig. 2
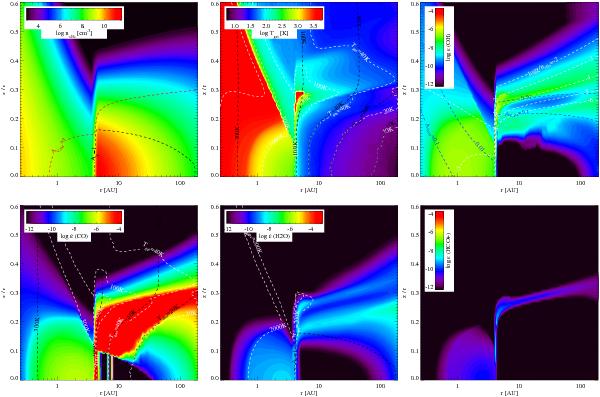
Basic plots for the standard disk model: (1) total hydrogen number density with red/black contours overlaid showing the radial/total extinction of 1; (2) gas temperature with contours overlaid for the gas temperature (white) and dust temperature (black); (3) OH abundance with the vertical extinction of 0.01 and 0.1 overlaid by blue contours and the PDR parameter log χ/n⟨ H ⟩ = −2, ... −6 overlaid by white contours; (4) CO abundances with gas temperature contours (white) and dust temperature contours (black); (5) water abundance with the total extinction AV = 1 overlaid in black and the gas temperature contours (white) and (6) HCO+ abundance.
Current usage metrics show cumulative count of Article Views (full-text article views including HTML views, PDF and ePub downloads, according to the available data) and Abstracts Views on Vision4Press platform.
Data correspond to usage on the plateform after 2015. The current usage metrics is available 48-96 hours after online publication and is updated daily on week days.
Initial download of the metrics may take a while.