Fig. 10
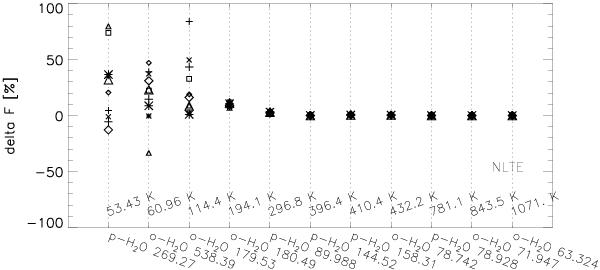
Percentage change in line fluxes for a series of water lines due to varying collision cross sections randomly within a factor 10. The symbols correspond to 10 different sets of collision cross sections. The labeling of the x-axis shows the excitation temperature of the upper level (top) and the line identification with wavelength (bottom).
Current usage metrics show cumulative count of Article Views (full-text article views including HTML views, PDF and ePub downloads, according to the available data) and Abstracts Views on Vision4Press platform.
Data correspond to usage on the plateform after 2015. The current usage metrics is available 48-96 hours after online publication and is updated daily on week days.
Initial download of the metrics may take a while.