| Issue |
A&A
Volume 551, March 2013
|
|
|---|---|---|
| Article Number | A74 | |
| Number of page(s) | 13 | |
| Section | Stellar atmospheres | |
| DOI | https://doi.org/10.1051/0004-6361/201219977 | |
| Published online | 25 February 2013 | |
The young stellar population of IC 1613
III. New O-type stars unveiled by GTC-OSIRIS⋆,⋆⋆,⋆⋆⋆
1 Instituto de Astrofísica de Canarias, C/Vía Láctea s/n, 38200 La Laguna, Tenerife, Spain
e-mail: This email address is being protected from spambots. You need JavaScript enabled to view it.
2 Departamento de Astrofísica, Universidad de La Laguna, Avda. Astrofísico Francisco Sánchez, s/n, 38071 La Laguna, Tenerife, Spain
Received: 9 July 2012
Accepted: 16 November 2012
Abstract
Context. Very low-metallicity massive stars are key to understanding the reionization epoch. Radiation-driven winds, chief agents in the evolution of massive stars, are consequently an important ingredient in our models of the early-Universe. Recent findings hint that the winds of massive stars with poorer metallicity than the SMC may be stronger than predicted by theory. Besides calling the paradigm of radiation-driven winds into question, this result would affect the calculated ionizing radiation and mechanical feedback of massive stars, as well as the role these objects play at different stages of the Universe.
Aims. The field needs a systematic study of the winds of a large sample of very metal-poor massive stars. The sampling of spectral types is particularly poor in the very early types. This paper’s goal is to increase the list of known O-type stars in the dwarf irregular galaxy IC 1613, whose metallicity is lower than the SMC’s roughly by a factor 2.
Methods. Using the reddening-free Q pseudo-colour, evolutionary masses, and GALEX photometry, we built a list of very likely O-type stars. We obtained low-resolution (R ~ 1000) GTC-OSIRIS spectra for a fraction of them and performed spectral classification, the only way to unequivocally confirm candidate OB-stars.
Results. We have discovered 8 new O-type stars in IC 1613, increasing the list of 7 known O-type stars in this galaxy by a factor of 2. The best quality spectra were analysed with the model atmosphere code FASTWIND to derive stellar parameters. We present the first spectral type – effective temperature scale for O-stars beyond the SMC.
Conclusions. The target selection method is successful. From the pre-selected list of 13 OB star candidates, we have found 8 new O-stars and 4 early-B stars and provided a similar type for a formerly known early-O star. Further tests are needed, but the presented procedure can eventually make preliminary low-resolution spectroscopy to confirm candidates unnecessary. The derived effective temperature calibration for IC 1613 is about 1000 K hotter than the scale at the SMC. The analysis of an increased list of O-type stars will be crucial for studies of the winds and feedback of massive stars at all ages of the Universe.
Key words: stars: early-type / stars: massive / stars: fundamental parameters / stars: Population III / galaxies: stellar content / galaxies: individual: IC 1613
Based on observations made with the Gran Telescopio Canarias (GTC), installed in the Spanish Observatorio del Roque de los Muchachos of the Instituto de Astrofísica de Canarias, on the island of La Palma. Programme ID GTC59-11B.
Figures 4, 6 and Appendix A are available in electronic form at http://www.aanda.org
Spectra as FITS files are available in electronic form at the CDS via anonymous ftp to cdsarc.u-strasbg.fr (130.79.128.5) or via http://cdsarc.u-strasbg.fr/viz-bin/qcat?J/A+A/551/A74
© ESO, 2013
1. Introduction
Massive stars are crucial to understanding the Universe because of their impact on many astrophysics fields. Mighty stellar winds and ionizing radiation fields, along with their violent ending as supernova disrupt their surrounding media and contaminate it with the products of the nuclear reactions that feed these titans. Our interest in very low-metallicity massive stars is growing rapidly because of their role in the early Universe. In the primordial extremely metal-poor environment, the formation of high-mass stars was favoured (Bromm et al. 2002), and these started the re-ionization of the Universe. Massive stars are suspected progenitors of long gamma ray bursts (long-GRBs Georgy et al. 2009; Woosley & Heger 2006), and this connection may explain the highest frequency of long-GRBs with higher redshift and decreasing metallicity (Gehrels et al. 2009, and references therein).
Blue massive stars (BMS) experience radiation-driven winds, which are powered by the scattering of photons in numerous UV transitions of metallic ions, and therefore strongly depend on metallicity. Radiation-driven winds are one of the central pillars of the current paradigm of massive stars, because the wind removes mass from the star and changes the physical conditions at the stellar core. The wind directly or indirectly regulates the evolution of the star, its ionizing, mechanical and chemical feedback, the supernova (SN) explosion and the type of compact object left (Georgy et al. 2009; Woosley et al. 2002).
Theory predicts a strong correlation between the momentum carried by the wind and the luminosity of the star and metallicity: the wind-momentum luminosity relation (WLR, Kudritzki et al. 1995). This relation and its metallicity dependence have been thoroughly characterized both by theoreticians (e.g. Vink et al. 2001) and by observations (Mokiem et al. 2007) from the Milky Way (MW) down to the metallicity of the Small Magellanic Cloud (SMC). Very low-metallicity BMS are expected to experience weaker winds than SMC stars and much weaker winds than MW stars. However, some recent results are in marked contrast.
We have found a resolved Luminous Blue Variable star (LBV) of very low metallicity (~0.2 Z⊙, Herrero et al. 2010) with strong optical P Cygni profiles. An analogous example exists in NGC 2366 (Drissen et al. 2001), and similar unresolved cases may exist in more distant galaxies (Pustilnik et al. 2008; Izotov et al. 2011). Tramper et al. (2011) report six stars with stronger wind momentum than expected from the poor metallicity of their host galaxies (~1/7 Z⊙) from X-Shooter spectroscopic analyses, although error bars are too large for results to be determinant. Our analysis of an Of star in IC 1613 (Herrero et al. 2012) concluded that the star may have a strong wind or, alternatively, a slower than expected wind acceleration. Lucy (2012) argues that the neglect of wind clumping may explain these findings, but also suggests that the discrepancy may be caused by an additional wind-driving mechanism operating only at certain metallicities, temperatures and luminosities, or negligible in the Galactic counterparts. The Herrero et al. (2012) and Tramper et al. (2011) examples, if confirmed by the detailed study of a large sample of objects, pose a challenge to the standard theory of radiation line-driven winds, since there are few metals to drive the wind. Nevertheless, this might explain why long-GRBs (typically associated with type Ic SN, Woosley & Heger 2006) are mostly found in metal-poor environments (Modjaz et al. 2008; Levesque et al. 2010) but require a strong wind to remove the H and He envelope in the pre-SN stages.
Besides the wind mechanical energy, the ionizing radiation emitted by massive stars is a chief interface of the pre-SN stages with the interstellar medium. The production of ionizing photons can be estimated to first order from the effective temperature (Teff), making Teff vs. spectral type calibrations a very useful tool. While the temperature scale for the Milky Way and the Magellanic Clouds have been addressed by a number of works (e.g. Garcia & Bianchi 2004; Martins et al. 2005b; Massey et al. 2009), no characterization for lower metallicity environments exists.
To study very metal-poor BMSs we need to reach out into the Local Group, beyond the Magellanic Clouds (Garcia et al. 2011). IC 1613 is the closest Local Group galaxy (DM = 24.27 Dolphin et al. 2001; E(B − V) = 0.02 Lee et al. 1993) with on-going star formation and poorer metallicity than the SMC: ~0.13 Z⊙ from B-supergiants (Bresolin et al. 2007), ~0.05 Z⊙ from nebular studies (Bresolin et al. 2007; Peimbert et al. 1988; Talent 1980; Davidson & Kinman 1982). Bresolin et al. (2007) published a catalogue of about 40 OB-stars in this galaxy, found from VLT-FORS2 MOS observations, but it only lists six O-types (4 of them were observed and analysed by Tramper et al. 2011). These, together with the Of star analysed in Herrero et al. (2012), make a total of seven O-type stars known in IC 1613, insufficient for a statistical characterization of the WLR at very low metallicities.
It is necessary to extend the sample of known O-stars in IC 1613, but so far low-resolution spectroscopy has been needed to unequivocally confirm O-candidates. In this paper we present new OB-stars in IC 1613 found from low-resolution spectra taken with the Gran Telescopio Canarias (GTC). The targets were selected using a set of photometry-based criteria that works well for O-stars as endorsed by the derived spectral types. This work is part of our study of the BMS population of IC 1613, and it uses the photometric catalogue and study of OB associations published in Garcia et al. (2009, hereafter GHV09) and Garcia et al. (2010, hereafter GHC10). All stellar identification numbers refer to the GHV09 catalogue, unless otherwise specified.
We present the target selection procedure optimized for O-type stars in Sect. 2. The observations and data reduction are detailed in Sect. 3. In Sect. 4 we provide spectral types for the targets, and in Sect. 5 we derive their stellar parameters. Finally, our conlusions are provided in Sect. 6.
Coordinates, photometric data, and association membership for the sample stars, from GHV09.
2. Target selection
O-type stars cannot be chosen solely from optical photometry, since their colours are very similar to those of the slightly cooler B-types. So far spectral types are needed to unequivocally spot out O-stars, but this may be costly in observing time since they are often obscured by gas and dust and quite faint. We therefore need to device a method to produce a sound list of very likely O-type stars, and additional criteria (besides photometric colours) are needed to this end.
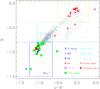 |
Fig. 1 IC 1613’s U − B vs. Q diagram. Black dots mark catalogue stars with high-quality photometry from GHV09. Other colours and symbols, except for filled stars, mark the position of stars with known spectral types from Bresolin et al. (2007). O- and early-B-stars are concentrated in boxes 1 and 2. The pink star represents 62 024, an Of star analysed by Herrero et al. (2012). Red stars represent the sample of Tramper et al. (2011) in IC 1613. Green stars mark this paper’s targets. |
GHV09 showed that OB-stars are found in a particular locus of the U − B vs. Q diagram (see Fig. 1 and GHV09-Fig. 4b), Q being the reddening-free pseudo-colour Q = U − B − 0.72 × (B − V). The explanation is that Q increases monotonically towards later spectral types in the interval Q ∈ [−1.0, −0.4], corresponding to O3-A0 types (see e.g. the calibration of Fitzgerald 1970, and GHC10). While Q is an indicator of spectral type, U − B holds the information of whether the star is reddened or not. The pseudo-colour Q is the primary target-selection criterion: starting from a catalogue with small photometric errors (<0.05 mag) to minimize the impact on Q, we chose “blue-Q” stars with Q < − 0.8. An additional advantage of choosing stars mainly from Q instead of classical B − V cuts, is that locally reddened targets are not discarded (see Fig. 2).
Nevertheless, to separate O and B stars (see GHV09) further information is needed. From IC 1613’s “blue-Q” stars, we chose those with the highest evolutionary mass (>25 M⊙, derived by GHC10) that matched stellar-like sources in GALEX-FUV images. We allowed for magnitudes as faint as V = 19.8 as long as the GALEX detection was clear.
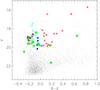 |
Fig. 2 IC 1613’s colour−magnitude diagram. Colours and symbols as in Fig. 1. OB-stars are dispersed in the colour−magnitude diagram, and do not concentrate on the galaxy’s blue-plume. In view of this diagram three targets are remarkably reddened, and would have been discarded with classical B − V colour cuts. The brightest stars of the blue-plume are early-B supergiants. |
The procedure is not free of caveats. From its definition it follows that the Q-parameter depends on the adopted reddening law and is subject to larger photometric errors than individual filters. Besides that, some O stars exhibit Q > −0.8 and would not be included in the current selection. Nonetheless, our selection criteria made the hunt for O-type stars more effective.
The list of candidate OB-stars and their photometry is provided in Table 1. We also included in the spectroscopic follow-up two objects with colours similar to the known WO and LBV-candidate stars in IC 1613 (see GHV09), one previously known O star (65426, O5-6 V, Bresolin et al. 2007), and two additional blue but fainter stars that serendipitously fell in the slit. Their location in IC 1613 is shown in Fig. 3. Figures 1 and 2 illustrate their position in the U − B vs. Q and colour−magnitude diagrams. The finding charts are provided in Appendix A.
Observation log.
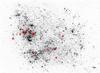 |
Fig. 3 IC 1613, GALEX’s FUV-channel. North is up and east to the left. Plus symbols mark the position of the sample stars, chosen with the following criteria: blue Q-parameter (Q < −0.8), V-magnitude (V < 19.8), intense emission in GALEX images, high evolutionary mass (M > 25 M⊙), and no Hα emission whenever possible. |
3. Observations and data reduction
The observations were carried out with the Optical System for Imaging and low-Resolution Integrated Spectroscopy (OSIRIS) at the 10 m-telescope GTC. The programme was granted five hours under proposal GTC59-11B (PI M. Garcia), in service mode. The observations consisted of long-slit spectroscopy taken with the R2000B grism and 1.2″ slits. The spectra cover the ~4000−5500 Å range with resolving power R ~ 1000, suitable to performing spectroscopic classification. The spectra are correctly oversampled (about 5 pixels) and can be rebinned to improve the signal-to-noise ratio (S/N).
The slits were oriented at specific angles to include several targets. One one-hour long observing block (OB) was devoted to each slit. The observing conditions are compiled in Table 2.
3.1. Data reduction
Reduction was performed according to standard IRAF1 procedures. Each slit OB was split into two 1249s exposures to enable cosmic ray removal. The exposures were coadded prior to any reduction procedure (case-A), with the imcombine routine and the crreject mechanism for cosmic-ray rejection. We checked against displacement between consecutive exposures and found shifts of up to seven pixels in extreme cases (slightly larger than one resolution element) in the spectral direction. For this reason we also reduced the individual exposures of all stars separately, and coadded the two spectra at the end of the reduction (case-B), to avoid problems with wavelength shifts. We compared the resulting spectra from case-A and case-B reduction and found undetectable differences, with better cosmic-ray extraction in case-A, which we adopted.
The ccdproc routine was used to trim the images and remove vignetted areas of the CCD, and also for bias subtraction and flat-field correction. The bias correction was performed using the overscan region. Each spectrum was flat-field-corrected with the normalized attached daytime flats for that OB. After checking against shifts between the master arcs provided by the observatory and the attached arcs, the former were used for wavelength calibration because of their increased S/N. A 2D wavelength calibration solution was obtained and assigned to the data using iraf routines identify, reidentify, fitcoords, and transform.
We note that the arc lamp image displays diffuse light on the right part of chip-1 at λ ≳ 5500 Å, and the red wavelength calibration for stars whose spectra form in this region of the CCD is not reliable. The GTC observatory also reported intermmitent technical problems with OSIRIS’s active collimator during the dates of the observations, which may affect the stability of the wavelength calibration. Both factors could explain the wavelength calibration problem reported in Sect. 5. However, neither of them hamper the identification of spectral lines or the derivation of stellar parameters, hence have no negative impact on this paper goals.
The apall task was used for target extraction and background subtraction. Background subtraction was complicated since a fraction of the targets were located in crowded regions, and some of them also experienced nebular contamination. The fit to background levels was performed at the physical line of the image equivalent to 4500 Å, free of nebular transitions. If two stars were very close together, their apall aperture was chosen to minimize contamination from the neighbour. Some targets exhibit a pedestal in the transversal cut, which could be caused by either nebular contamination or crowding. We checked Hα images to evaluate the first option and, in the event of Hα detection, the sky aperture was chosen close to the star, at the pedestal. If there was no Hα detection, then we interpreted that the plateau had a stellar origin, and the sky contribution was chosen far from the pedestal.
Finally, the R2000B grism of GTC-OSIRIS experiences a ghost image, with a negligible number of counts in the science or arc images. However, a non-negligible structure remains in the flat-field after normalization, which is transmitted to the science image after the flat-field correction. The ghost position varies between different flat-field images, but we made a conservative estimate of the wavelength ranges that may be affected: 4738−4778 Å (chip1) and 4736−4784 Å (chip2).
The reduced stellar spectra are shown in Figs. 4a,b.
4. Spectral classification
Spectral classification was made after the Walborn & Fitzpatrick (1990) and Lennon et al. (1992) criteria for Milky Way stars, bearing in mind the metallicity effects, as explained in Castro et al. (2008) and summarized in Castro (2010). As far as we know, no spectral classification criteria exist for metallicity lower than the SMC. We avoided diagnostics involving simultaneously metallic and non-metallic lines whenever possible. They may be misleading owing to the different metalicities of IC 1613 and the MW. Spectral sub-types for O-stars were derived by comparing mainly the ratios of the lines HeII4541/HeI4471, HeII4200/HeI+HeII4026, HeII4541/HeI4387, and HeII4200/HeI4144, and the luminosity class from the HeII4686 line and the SiIV4089/HeI4121 ratio. The main diagnostics for B spectral sub-types were SiIV4089/SiIII4552, MgII4481/HeI4471, SiIII4552/SiII4128, SiIII4552/MgII4481, and SiII4128/HeI4121, and for luminosity class SiIV4089/HeI4121 and SiIII4552/HeI4387. Since the luminosity criteria often involve the undesired He-to-metal ratio, we checked that the observed visual magnitude, corrected from extinction, agrees with the calibration for the assigned luminosity class. The spectral classifications are provided in Table 1.
The main sources of uncertainty are poor S/N, poorly removed or over-subtracted nebular contamination, unremoved cosmic-rays (exposure times were long and only 2 exposures per target were taken), and the difficult normalization around Hδ, which affects all diagnostics involving SiIV4089 and HeI4121. Additionally, the increased background levels of the OBs executed in bright time hamper the detection of the weakest spectral lines; it is possible that weak HeII lines are not detected in actual late-O stars, resulting in a bias towards B-types.
We estimate that spectral types are uncertain by about 1−2 sub-types, depending very much on the S/N of the spectrum and the nebular contamination. Nonetheless, we are confident with the O and B classification: HeII lines are clear in the O-types; HeI and Si lines are clear in the B-types; and all the spectra show stellar wings in the Balmer lines. As we have pointed out, the only risk in this sense is that early-B stars may actually be late-O stars with very weak HeII lines, undetected due to high background levels.
From the maximum expectation of discovering thirteen new O-type stars, we have found eight O-stars and four early-B stars, and provided a similar spectral type for the formerly known early-O star 65426. 35 071, whose colours were similar to the LBV-candidate V39, was classified as a B-type star.
We were not able to classify the three remaining stars because their spectral S/N was extremely poor. Star 68 456, located close to IC 1613’s WO in the U − B vs. Q diagram, is dominated by nebular lines with no trace of WR’s typical broad wind emissions. Both 44 736 and 67 063 exhibit Balmer lines, and seem to also show HeI lines, but the spectra are too noisy for classification.
4.1. Notes on individual targets
64066 (O3 III((f))): this star displays strong HeII lines, whereas HeI lines can hardly be seen. The spectrum also exhibits stellar Balmer wings with intense nebular lines at the core. We examined the subtracted sky spectrum and concluded that it seems unlikely that the absence of HeI lines is caused by nebular contamination. Since NIII4634-40-42 is weak in emission, the star is classified as O3III((f)). There may be emission from NIV4058 in the spectrum that would render the star an ((f*)), and also from CIII4647-50-51; however, the S/N is too poor to be conclusive. 64066 is very close to the O9 V star 63747, ~0.5 mag fainter, but contamination is unlikely given the absence of HeI lines in the spectrum of 64066.
65426 (O6 III): this target is located inside nebulosity, and the [OIII] lines indicate incomplete sky subtraction. The star displays broad stellar Balmer wings with strong nebular lines at the core. However, HeI lines do not seem contaminated by the nebula. HeII4686 has an artificial P Cygni-like profile caused by a strong cosmic ray in one of the exposures. We only consider the absorption part of the line. The star was previously classified as O5-6 V by Bresolin et al. (2007), but we find a slightly later spectral type and higher luminosity class, O6 III.
69476 (O6.5 III): the star is located inside GS1 (Meaburn et al. 1988), one of the large bubbles of the galaxy, and the sky subtraction is problematic. The [OIII]5007 line indicates a slight sky under-subtraction, while the profile of the Balmer lines at the core hint that the nebular contribution has been over-subtracted. HeI4387 may also experience nebular contamination, but other HeI lines seem free of nebulosity. The HeII lines are broader than HeI. There may be emission from NIII4634 and CIII4647-50-51, which would render the star an ((fc)) type, but S/N is too poor to be conclusive.
36611 (O7 III-V): this star was observed in bright time and almost at twilight, which explains the comparatively poor S/N of its spectrum. The [OIII] lines indicate severe nebular contamination, and the spectrum displays strong nebular lines at the core of the stellar Balmer lines. The HeII lines are broader than the HeI lines and seem to have substructure. The GHV09 catalogue has two very close sources about 1′′ to the SW, which are fainter by 0.8 and 2.3 mag. We mark 36611 as possibly multiple.
The P Cygni-like shape of HeI4471 is caused by a cosmic ray in one of the exposures that has not been totally removed. HeII4686 is a bit stronger than HeII4541, indicating class-V, but the SiIV4089/HeI4121 ratio suggests class-III. The star’s absolute magnitude, if single, is also consistent with an intermediate luminosity class.
75661 (O8 III): the normalization of this star is very problematic and hampers spectral classification. The [OIII]5007 nebular emission indicates that the nebular extraction was not complete. The spectral diagnostics disagree: the HeII4686/HeII4541 ratio clearly indicates that the star has an earlier spectral type than O8, but HeII4541/HeI4471, HeII4200/HeI4144, and HeII4200/HeI+HeII4026 point towards later spectral types. There seems to be MgII4481 in the spectrum. The weak HeII4686 could be due to a relatively strong wind filling the line, which would agree with the relatively weak Hβ line. The assigned type is a compromise of these pieces of evidence, but the possibility that the star is a binary, especially considering the difficulties in determining its radial velocity, is high. The assigned radial velocity −250 km s-1 matches HeII4541, HeII4686, Hβ, HeI4922, and HeI4387, but Hγ, HeI4471, and HeII4200 indicate vrad = −350 km s-1. The luminosity class was derived by extrapolating criteria from the earlier O6 types. The star’s absolute magnitude is close to the value calibrated for O8 supergiants by Massey (1998).
67684 (O8.5 I): the [OIII] lines in absorption indicate that the sky was over-subtracted, which explains the strong artificial absorption at the core of the Balmer series. The spectral S/N is poor, because the star was observed at large airmass and bright time conditions. The normalization of the spectrum was problematic and hinders spectral classification. He lines are apparently found in broad bands with overlapped narrow lines. HeII4686 looks asymmetric and seems to have several components. The spectral S/N prevents us from deciding whether this is an artefact from normalization or the star is multiple or actually a compact cluster. Nonetheless, HeII4686 and HeII4200 are strong. We mark it as possibly composite spectrum.
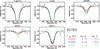 |
Fig. 5 Best fit FASTWIND model (red, solid line) to sample star 60 782 (black). The chart shows the principal diagnostic spectral lines: Hγ and Hβ (gravity), HeII4541 and HeI4471 (Teff), and HeII4686 (log Q ). To illustrate that Teff is well constrained within the error bars, two additional models (nonsolid lines) with Teff varying ±2000 K are shown. The fit of these two models to the HeII4541 diagnostic line is poor, defining the error bars for temperature. |
60782 (O9.5 III): the star is located in a region of nebulosity with intense emission in the Balmer lines. The [OIII]5007 line indicates a slight sky over-subtraction. The spectrum may be contaminated by 61331, which is very close to it, and 0.5 mag brighter, but 60782’s wider Balmer lines and spectral morphology in general suggest otherwise. There is also a nearby star with very similar V-magnitude and Q-colour (60794, V = 19.64, Q = −0.99), but it should be left out of the slit at the chosen position angle of the observations. During spectral extraction with apall, additional fainter nearby stars were detected.
SiIV4089 is blended with Hδ, making luminosity classification difficult.
61331 (O9.7 II): the star is located in a region of nebulosity with intense emission in the Balmer lines. The [OIII]5007 nebular line indicates sky over-subtraction, which explains the artificial absorption at the core of the Balmer lines. The apparent emission of HeII4541 is due to a cosmic-ray in one of the exposures. The star is very close to 60 782, but contamination seems unlikely as the latter is 0.5 mag fainter. The lines of hydrogen, HeI and HeII, yield different radial velocities. The apparent mismatch between HeI and HeII is probably due to a poorly removed cosmic ray in the wing of HeI4471 and the one at HeII4541. The adopted radial velocity was calculated with HeI lines. The HeII4200 line is very weak. The luminosity indicator SiIV4089/HeI4121 suggests a class between I and III, hence the assigned class-II. The star’s absolute magnitude, calculated from the apparent magnitude corrected by extinction, is also consistent with an intermediate class.
71708 (late-O III + neb.): spectral quality is too poor to derive radial velocity; IC 1613’s systemic velocity, −234 km s-1 (Lu et al. 1993), is adopted. The spectrum displays broad stellar Balmer wings with strong nebular lines at the core. HeII lines, especially HeII4541 and HeII4686, are clearly seen and indicate an O-type. No spectral type can be assigned, however, since the spectrum displays no stellar HeI lines, very likely due to nebular contamination. SiIII4552 is not seen in the spectrum. HeII4686 is strong in absorption, and stronger than HeII4541; according to the luminosity criteria, this corresponds to luminosity classes III and V for spectral types O8-O9. Its absolute magnitude agrees with the MV calibrated for a late-O giant (Massey 1998).
60269 (B0.5 I): the [OIII]5007 line indicates sky over-subtraction, which explains the asymmetry and strong absorption at the core of the Balmer lines. There is a velocity shift between the nebular lines (at IC 1613’s systemic velocity, measured from the sky spectrum) and the Balmer absorption from the final spectrum. HeI and metal lines experience a smaller shift.
This star was not a primary target of the observing run since it is very faint (V = 20.5) and consequently its spectrum is noisy. All B-sub-type diagnostics point towards an early-B type, but the absence of HeI4121 hints at B8-9 types. However, it is possible that HeI4121 is contaminated by nebular emission and this diagnostic was discarded. In the absence of HeII4686 and HeI4121 lines, the luminosity class was assigned only from the SiIII4552/HeI4387 ratio, resulting in class-I. However, the Balmer lines are too broad for a supergiant: the star may be a late-O type star with undetected HeII lines due to high background level compared to the stellar spectrum signal. Its absolute magnitude (MV ≲ − 4) is consistent with the star being a late-O or an early-B dwarf star, but not with a supergiant (MV = −6). The possibility that its spectrum is contaminated by the very nearby star 60782 (O9.5III) which is 1mag brigther cannot be discarded.
60882 (B0.5 I-III): the [OIII] lines indicate correct background extraction, although the profiles of the Balmer series core indicate a slight over-subtraction. This star was observed in bright time and almost at twilight, which explains the comparatively poor S/N of its spectrum. No HeII lines can be seen except perhaps HeII4541; the high background level of the exposures could be hiding the presence of weak HeII lines, but the SiIII triplet is strong and suggests a B-type. The SiIV4089/HeI4121 ratio indicates class-I but SiIII4552/HeI4387 suggest class-III.
35071 (B2.5 III): the star seems double in the OSIRIS acquisition image, which has enhanced resolution compared to GHV09’s INT-WFC catalogue. The criteria based on MgII4481, HeI4471, and SiIII4552 point towards types B2.5-3. We note, however, that the presence of SiII4128, expected at this spectral sub-type at higher metallicities, is not clear.
5. Spectroscopic analysis
The resolution and S/N of the dataset enabled a rough determination of the stellar parameters of the sample O-stars. We used synthetic spectra calculated with FASTWIND version 10.1 (Puls et al. 2005), which takes line blanketing, non-LTE effects, and radiation driven winds into account, to fit mainly Hγ, Hβ, HeII4686, HeII4541, and HeI4471, and secondarily HeII4200, HeII5411, HeI4387, and HeI4922.
The synthetic spectra were taken from a vast grid of FASTWIND models with metallicity 0.13 Z⊙, computed using the CONDOR facilities at the IAC (Simón-Díaz et al. 2011). This is the equivalent metallicity to the oxygen abundance derived by Bresolin et al. (2007) for B-supergiants in IC 1613. The grid covers from 28 000 to 55 000 K, gravity ranging log g = 2.6−4.3 (depending on temperature), and wind-strength Q-parameter log Q = Ṁ/(v∞ R∗)1.5 from −15.0 to −11.7. The exponent of the wind velocity law β, the helium abundance, and the microturbulence also vary in the grid, but were kept constant to typical values for this analysis: β = 0.8, ϵHe = 0.09, and ξ = 10 km s-1.
Starting from effective temperature and gravity values that are typical of the star’s spectral type, we varied Teff in 1000 K steps to simultaneously fit HeII and HeI lines. We then fixed Teff, and varied log g in 0.1 dex steps to fit the wings of the Balmer lines. The core was discarded since nebular contamination was severe, or unquantifiable, in many cases. The best-fitting gravity value usually requires recalculating Teff, therefore we iterated this process until all considered spectral lines were fitted except for HeII4686. The observations do not include Hα, but HeII4686 also provides information on the wind. We fitted this line by changing the wind strength log Q parameter. If the wind is not negligible, it alters other lines under analysis, and the whole process must be iterated again to adjust temperature and gravity. Only when HeII4686 displays a clearly non-photospheric profile (e.g. asymmetric), we allowed β to vary.
At the spectral resolution of the dataset, rotational and macroturbulent velocities could not be derived unless they were as high as ~250 km s-1. We also measured radial velocities for the targets. We noted some problems with the wavelength calibration, especially in the red part of the spectrum, which affected the HeII5411 line. This cannot be explained by the shifts detected between consecutive exposures, but rather to the reported calibration problems in the red part of some spectra (Sect. 3).
The spectral quality of the dataset enabled determination of effective temperatures within ±2000−3000 K, as shown in Fig. 5. Typical errors bars for log g are ±0.2. We do not quote errors for log Q because the method provides a rough estimate of the wind’s influence on other stellar parameters, and the derived values must only be considered indicative.
The spectral fit to the sample O-stars is shown in Fig. 6. Results are presented in Table 3.
Parameters derived for the sample stars.
Comments on individual targets
64066 (O3III((f))): this star only displays absorption lines of HeII, with no trace of HeI. We were able to derive only a lower limit for effective temperature, consequently gravity is also poorly constrained.
69476 (O6.5III): nebular contamination meant that Hβ could not be used for analysis. The helium lines are very broad, so we adopted vsini = 250 km s-1. The HeII4541 and HeII4686 lines indicate vrad ~ −280 km s-1, but HeI and Balmer transitions yield ~−350 km s-1. Star 69476 is inside the bubble GS1, and the different radial velocities could be artificial and caused by undetected nebular contamination of gas masses moving at different radial velocities than the star. However, we examined the sky spectrum, and there seems to be no nebular emission in HeI or HeII lines. Another possible explanation is that the star is a binary. We adopted the radial correction calculated with HeI lines.
60782 (O9.5III): the best fit to HeII4686 would actually require log Q = −13.0, but Balmer lines could not be fitted with this strong wind even if log g is increased. Contamination by nearby objects (see Sect. 4.1) could be a possible explanation.
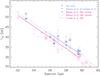 |
Fig. 7 Very low-metallicity temperature scale for O- and early-B stars, including this paper’s results and the stars analysed by Tramper et al. (2011) and Herrero et al. (2012) in IC 1613. Different symbol size indicates different luminosity class (smallest symbols = class V, largest symbols = class I). For comparison, we have included derived temperatures for OB-stars in the SMC from Mokiem et al. (2007) and Massey et al. (2009) (violet), and Trundle et al. (2007)’s calibration for SMC B supergiants (dashed-thick) and dwarfs (dashed-thin). Solid lines represent linear regressions to the joint sample of O-giants and supergiants in the SMC (violet) and IC 1613 (blue). The high end of the temperature scale in IC 1613 is not well constrained, hence marked with a dotted line. |
61331 (O9.7II): HeII4686 is blue-shifted and narrow, and is not reproduced by any combination of β and log Q .
5.1. The very low-metallicity temperature scale
We present the first sub-SMC temperature scale in Fig. 7. It includes all O-type stars in IC 1613 whose effective temperature has been derived from quantitative spectroscopic analysis: the eight stars analysed in this paper, plus five stars from Tramper et al. (2011) and Herrero et al. (2012). For comparison, we have added temperature determinations of SMC OB-stars from Mokiem et al. (2007) and Massey et al. (2009), and the temperature scale for SMC B-supergiants derived by Trundle et al. (2007). At the same spectral type, the temperatures we derive for IC 1613 stars are similar to SMC stars, even though slightly hotter.
We calculated a least-squares linear regression to the temperatures of the total sample of analysed giants and supergiants in IC 1613. We proceeded similarly with SMC stars (Mokiem et al. 2007; Massey et al. 2009). The high end of IC 1613’s temperature scale was not well constrained, since we could only derive a lower temperature limit for the giant O3 of the sample. The other O3 star (from Tramper et al. 2011) is a dwarf so it was not considered in the fit. As a test, we discarded the three stars marked as binary/multiple in Table 1 and obtained a very similar temperature scale. Uncertain binarity may introduce some scatter in the derived relation but does not change it overall.
The derived scale is ~1000 K hotter for IC 1613 than for the SMC, as expected given IC 1613’s poorer metal content. It may be argued whether the difference is significant given the error bars of all points considered: ~2500 K in this work vs. typically ~1000 K, but reaching up to ~2000 K for some targets, in Mokiem et al. (2007). Our programmed future work will produce a sound temperature scale for IC 1613 from enhanced resolution and S/N spectra of a larger sample of stars in this galaxy.
6. Summary and future work
Very low-metallicity massive stars are growing more and more important for our understanding of the high-redshift, very metal-poor Universe. Current models for the first generations of stars rely on knowledge of present-day massive stars, with radiation-driven winds being a main pillar. While the paradigm has been thoroughly tested in the Milky Way and the Magellanic Clouds, recent findings indicate that a different wind-driving mechanism may be at work at poorer metallicities. The evolutionary models for population-III massive stars, and the estimates of their ionizing, mechanical, and chemical feedback would have to be recomputed. Only the quantitative spectroscopic analysis of a large sample of very metal-poor massive stars can shed new light on these topics.
This work uses the 10 m telescope GTC as a Local Group explorer to unveil new OB-type stars in metal-poor environments beyond the SMC. From low-resolution long-slit spectroscopy, eight O-stars plus four early-B stars have been discovered. The total list of known O-type stars in IC 1613 has been increased by a factor of 2. A photometric-based selection method optimized towards O stars has been presented, which will save observing time for similar surveys in other galaxies. The extension of the sample of very metal-poor O stars is a fundamental first step in testing the theory of radiation-driven winds at sub-SMC metallicity.
The GTC-OSIRIS spectra were analysed with FASTWIND models to derive effective temperatures and gravities. From the results we have produced the first temperature scale for O-type stars beyond the SMC. The calibration yields higher temperatures for IC 1613 stars, as expected given their comparatively poorer metal content, but must be used with caution considering the large error bars of our results.
Follow-up spectroscopy of increased resolution and enhanced S/N is planned for a subset of the targets of this paper. Its quantitative analysis will provide more accurate stellar and wind parameters, and constraints to the wind theory. The sample will be as extensive as possible in its spectral type and luminosity class coverage so that new clues to the strong wind problem are found. Two interesting by-products will be produced: the first atlas of very metal-poor massive stars and a sound sub-SMC effective temperature calibration.
Online material
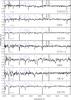 |
Fig. 4a GTC-OSIRIS spectra of OB-type stars in IC 1613. The spectra have been rebinned to 3 pixels and corrected by each star’s radial velocity, except for 71 708, for which we used IC 1613’s systemic velocity −234 km s-1 (Lu et al. 1993). The evolution of HeII4541/HeI4471 is clearly seen. |
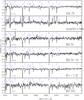 |
Fig. 4b continued. |
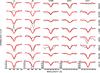 |
Fig. 6 Best fit FASTWIND model (red) to the sample stars (black). The chart shows the principal diagnostic spectral lines, as in Fig. 5. Stellar identification numbers are provided on the right-hand side of the plot. Axes are only provided for the bottom target for clarity’s sake; the same axes are used for the remaining stars. |
Appendix A: Finding charts for the sample stars
Finding charts for the newly identified OB stars are provided in this section. The images were taken with the Wide Field Camera (WFC) at the 2.5 m Isaac Newton Telescope (INT); for more details see GHV09. All the identification charts show a field of 2′ × 2′, observed with broad Harris V-band filter.
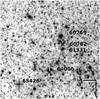 |
Fig. A.1 Stars 60269 (B0.5 I), 60782 (O9.5 III), 61331 (O9.7 II), 64066 (O3 III((f))) and 65426 (O6 III). |
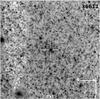 |
Fig. A.2 Star 36611 (O7 III-V). |
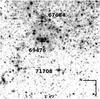 |
Fig. A.3 Stars 67684 (O8.5 I), 69476 (O6.5 III) and 71708 (late-O III+neb). |
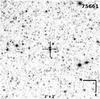 |
Fig. A.4 Star 75661 (O8 III). |
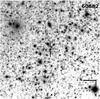 |
Fig. A.5 Star 60882 (B0.5 I-III). |
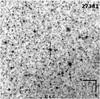 |
Fig. A.6 Star 27381 (B1-1.5 I). |
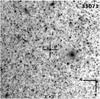 |
Fig. A.7 Star 35071 (B2.5 III). |
IRAF is distributed by the National Optical Astronomy Observatory, which is operated by the Association of Universities for Research in Astronomy (AURA) under cooperative agreement with the National Science Foundation.
Acknowledgments
This work has been funded by Spanish MICINN under Consolider-Ingenio 2010, programme grant CSD2006-00070, (http://www.iac.es/consolider-ingenio-gtc/), and grant AYA2010-21697-C05-04, and by the Gobierno de Canarias (PID2010119). We would like to thank A. Cabrera-Lavers for fruitful interaction during data processing. This research has made use of Aladin, and also data from the INT telescope (operated by the Isaac Newton Group in the Spanish Observatorio del Roque de los Muchachos).
References
- Bonnarel, F., Fernique, P., Bienaymé, O., et al. 2000, A&AS, 143, 33 [NASA ADS] [CrossRef] [EDP Sciences] [Google Scholar]
- Bresolin, F., Urbaneja, M. A., Gieren, W., Pietrzyński, G., & Kudritzki, R.-P. 2007, ApJ, 671, 2028 [NASA ADS] [CrossRef] [Google Scholar]
- Bromm, V., Coppi, P. S., & Larson, R. B. 2002, ApJ, 564, 23 [NASA ADS] [CrossRef] [Google Scholar]
- Castro, N. 2010, Ph.D. Thesis, Universidad de La Laguna [Google Scholar]
- Castro, N., Herrero, A., Garcia, M., et al. 2008, A&A, 485, 41 [NASA ADS] [CrossRef] [EDP Sciences] [Google Scholar]
- Davidson, K., & Kinman, T. D. 1982, PASP, 94, 634 [NASA ADS] [CrossRef] [Google Scholar]
- Dolphin, A. E., Saha, A., Skillman, E. D., et al. 2001, ApJ, 550, 554 [NASA ADS] [CrossRef] [Google Scholar]
- Drissen, L., Crowther, P. A., Smith, L. J., et al. 2001, ApJ, 546, 484 [NASA ADS] [CrossRef] [Google Scholar]
- Fitzgerald, M. P. 1970, A&A, 4, 234 [NASA ADS] [Google Scholar]
- Garcia, M., & Bianchi, L. 2004, ApJ, 606, 497 [NASA ADS] [CrossRef] [Google Scholar]
- Garcia, M., Herrero, A., Vicente, B., et al. 2009, A&A, 502, 1015 [GHV09] [NASA ADS] [CrossRef] [EDP Sciences] [Google Scholar]
- Garcia, M., Herrero, A., Castro, N., Corral, L., & Rosenberg, A. 2010, A&A, 523, A23 [GHC10] [NASA ADS] [CrossRef] [EDP Sciences] [Google Scholar]
- Garcia, M., Herrero, A., & Najarro, F. 2011, Ap&SS, 314 [Google Scholar]
- Gehrels, N., Ramirez-Ruiz, E., & Fox, D. B. 2009, ARA&A, 47, 567 [NASA ADS] [CrossRef] [Google Scholar]
- Georgy, C., Meynet, G., Walder, R., et al. 2009, A&A, 502, 611 [NASA ADS] [CrossRef] [EDP Sciences] [Google Scholar]
- Herrero, A., Garcia, M., Uytterhoeven, K., et al. 2010, A&A, 513, A70 [NASA ADS] [CrossRef] [EDP Sciences] [Google Scholar]
- Herrero, A., Garcia, M., Uytterhoeven, K., et al. 2011, IAU Symp., 272, 292 [NASA ADS] [Google Scholar]
- Herrero, A., Garcia, M., Puls, J., et al. 2012, A&A, 543, A85 [NASA ADS] [CrossRef] [EDP Sciences] [Google Scholar]
- Izotov, Y. I., Guseva, N. G., Fricke, K. J., & Henkel, C. 2011, A&A, 533, A25 [NASA ADS] [CrossRef] [EDP Sciences] [Google Scholar]
- Kingsburgh, R. L., & Barlow, M. J. 1995, A&A, 295, 171 [NASA ADS] [Google Scholar]
- Kudritzki, R.-P., Lennon, D. J., & Puls, J. 1995, in Science with the VLT, eds. J. R. Walsh, & I. J. Danziger (Springer Verlag), 246 [Google Scholar]
- Lee, M. G., Freedman, W. L., & Madore, B. F. 1993, ApJ, 417, 553 [Google Scholar]
- Lennon, D. J., Dufton, P. L., & Fitzsimmons, A. 1992, A&AS, 94, 569 [NASA ADS] [Google Scholar]
- Levesque, E. M., Kewley, L. J., Berger, E., & Zahid, H. J., et al. 2010, AJ, 140, 1557 [NASA ADS] [CrossRef] [Google Scholar]
- Lu, N. Y., Hoffman, G. L., Groff, T., Roos, T., & Lamphier, C. 1993, ApJS, 88, 383 [NASA ADS] [CrossRef] [Google Scholar]
- Lucy, L. B. 2012, A&A, 543, A18 [NASA ADS] [CrossRef] [EDP Sciences] [Google Scholar]
- Martins, F., Schaerer, D., Hillier, D. J., et al. 2004, A&A, 420, 1087 [NASA ADS] [CrossRef] [EDP Sciences] [Google Scholar]
- Martins, F., Schaerer, D., Hillier, D. J., et al. 2005a, A&A, 441, 735 [NASA ADS] [CrossRef] [EDP Sciences] [Google Scholar]
- Martins, F., Schaerer, D., & Hillier, D. J. 2005b, A&A, 436, 1049 [NASA ADS] [CrossRef] [EDP Sciences] [Google Scholar]
- Massey, P. 1998, Stellar astrophysics for the local group: VIII Canary Islands Winter School of Astrophysics, 95 [Google Scholar]
- Massey, P., Zangari, A. M., Morrell, N. I., et al. 2009, ApJ, 692, 618 [NASA ADS] [CrossRef] [Google Scholar]
- Meaburn, J., Clayton, C. A., & Whitehead, M. J. 1988, MNRAS, 235, 479 [NASA ADS] [Google Scholar]
- Modjaz, M., Kewley, L., Kirshner, R. P., et al. 2008, AJ, 135, 1136 [NASA ADS] [CrossRef] [Google Scholar]
- Mokiem, M. R., de Koter, A., Vink, J. S., et al. 2007, A&A, 473, 603 [NASA ADS] [CrossRef] [EDP Sciences] [Google Scholar]
- Peimbert, M., Bohigas, J., & Torres-Peimbert, S. 1988, Rev. Mex. Astron. Astrofis., 16, 45 [NASA ADS] [Google Scholar]
- Puls, J., Urbaneja, M. A., Venero, R., et al. 2005, A&A, 435, 669 [NASA ADS] [CrossRef] [EDP Sciences] [Google Scholar]
- Pustilnik, S. A., Tepliakova, A. L., Kniazev, A. Y., et al. 2008, MNRAS, 388, L24 [NASA ADS] [CrossRef] [Google Scholar]
- Simón-Díaz, S., Castro, N., Herrero, A., et al. 2011, J. Phys. Conf. Ser., 328, 012021 [NASA ADS] [CrossRef] [Google Scholar]
- Talent, D. L. 1980, Ph.D. Thesis, Rice Univ., Houston, TX [Google Scholar]
- Tramper, F., Sana, H., de Koter, A., & Kaper, L. 2011, ApJ, 741, L8 [NASA ADS] [CrossRef] [Google Scholar]
- Trundle, C., Dufton, P. L., Hunter, I., et al. 2007, A&A, 471, 625 [NASA ADS] [CrossRef] [EDP Sciences] [Google Scholar]
- Vink, J. S., de Koter, A., & Lamers, H. J. G. L. M. 2001, A&A, 369, 574 [NASA ADS] [CrossRef] [EDP Sciences] [Google Scholar]
- Walborn, N. R., & Fitzpatrick, E. L. 1990, PASP, 102, 379 [NASA ADS] [CrossRef] [Google Scholar]
- Woosley, S. E., & Heger, A. 2006, ApJ, 637, 914 [NASA ADS] [CrossRef] [Google Scholar]
- Woosley, S. E., Heger, A., & Weaver, T. A. 2002, Rev. Mod. Phys., 74, 1015 [NASA ADS] [CrossRef] [Google Scholar]
All Tables
Coordinates, photometric data, and association membership for the sample stars, from GHV09.
All Figures
|
Fig. 1 IC 1613’s U − B vs. Q diagram. Black dots mark catalogue stars with high-quality photometry from GHV09. Other colours and symbols, except for filled stars, mark the position of stars with known spectral types from Bresolin et al. (2007). O- and early-B-stars are concentrated in boxes 1 and 2. The pink star represents 62 024, an Of star analysed by Herrero et al. (2012). Red stars represent the sample of Tramper et al. (2011) in IC 1613. Green stars mark this paper’s targets. |
| In the text | |
|
Fig. 2 IC 1613’s colour−magnitude diagram. Colours and symbols as in Fig. 1. OB-stars are dispersed in the colour−magnitude diagram, and do not concentrate on the galaxy’s blue-plume. In view of this diagram three targets are remarkably reddened, and would have been discarded with classical B − V colour cuts. The brightest stars of the blue-plume are early-B supergiants. |
| In the text | |
|
Fig. 3 IC 1613, GALEX’s FUV-channel. North is up and east to the left. Plus symbols mark the position of the sample stars, chosen with the following criteria: blue Q-parameter (Q < −0.8), V-magnitude (V < 19.8), intense emission in GALEX images, high evolutionary mass (M > 25 M⊙), and no Hα emission whenever possible. |
| In the text | |
|
Fig. 5 Best fit FASTWIND model (red, solid line) to sample star 60 782 (black). The chart shows the principal diagnostic spectral lines: Hγ and Hβ (gravity), HeII4541 and HeI4471 (Teff), and HeII4686 (log Q ). To illustrate that Teff is well constrained within the error bars, two additional models (nonsolid lines) with Teff varying ±2000 K are shown. The fit of these two models to the HeII4541 diagnostic line is poor, defining the error bars for temperature. |
| In the text | |
|
Fig. 7 Very low-metallicity temperature scale for O- and early-B stars, including this paper’s results and the stars analysed by Tramper et al. (2011) and Herrero et al. (2012) in IC 1613. Different symbol size indicates different luminosity class (smallest symbols = class V, largest symbols = class I). For comparison, we have included derived temperatures for OB-stars in the SMC from Mokiem et al. (2007) and Massey et al. (2009) (violet), and Trundle et al. (2007)’s calibration for SMC B supergiants (dashed-thick) and dwarfs (dashed-thin). Solid lines represent linear regressions to the joint sample of O-giants and supergiants in the SMC (violet) and IC 1613 (blue). The high end of the temperature scale in IC 1613 is not well constrained, hence marked with a dotted line. |
| In the text | |
|
Fig. 4a GTC-OSIRIS spectra of OB-type stars in IC 1613. The spectra have been rebinned to 3 pixels and corrected by each star’s radial velocity, except for 71 708, for which we used IC 1613’s systemic velocity −234 km s-1 (Lu et al. 1993). The evolution of HeII4541/HeI4471 is clearly seen. |
| In the text | |
|
Fig. 4b continued. |
| In the text | |
|
Fig. 6 Best fit FASTWIND model (red) to the sample stars (black). The chart shows the principal diagnostic spectral lines, as in Fig. 5. Stellar identification numbers are provided on the right-hand side of the plot. Axes are only provided for the bottom target for clarity’s sake; the same axes are used for the remaining stars. |
| In the text | |
|
Fig. A.1 Stars 60269 (B0.5 I), 60782 (O9.5 III), 61331 (O9.7 II), 64066 (O3 III((f))) and 65426 (O6 III). |
| In the text | |
|
Fig. A.2 Star 36611 (O7 III-V). |
| In the text | |
|
Fig. A.3 Stars 67684 (O8.5 I), 69476 (O6.5 III) and 71708 (late-O III+neb). |
| In the text | |
|
Fig. A.4 Star 75661 (O8 III). |
| In the text | |
|
Fig. A.5 Star 60882 (B0.5 I-III). |
| In the text | |
|
Fig. A.6 Star 27381 (B1-1.5 I). |
| In the text | |
|
Fig. A.7 Star 35071 (B2.5 III). |
| In the text | |
Current usage metrics show cumulative count of Article Views (full-text article views including HTML views, PDF and ePub downloads, according to the available data) and Abstracts Views on Vision4Press platform.
Data correspond to usage on the plateform after 2015. The current usage metrics is available 48-96 hours after online publication and is updated daily on week days.
Initial download of the metrics may take a while.