Fig. 7
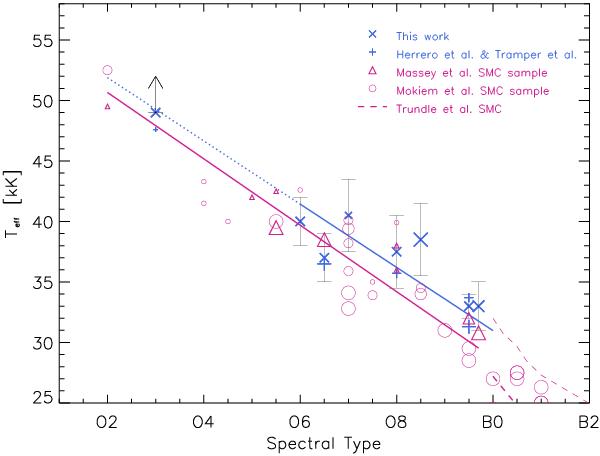
Very low-metallicity temperature scale for O- and early-B stars, including this paper’s results and the stars analysed by Tramper et al. (2011) and Herrero et al. (2012) in IC 1613. Different symbol size indicates different luminosity class (smallest symbols = class V, largest symbols = class I). For comparison, we have included derived temperatures for OB-stars in the SMC from Mokiem et al. (2007) and Massey et al. (2009) (violet), and Trundle et al. (2007)’s calibration for SMC B supergiants (dashed-thick) and dwarfs (dashed-thin). Solid lines represent linear regressions to the joint sample of O-giants and supergiants in the SMC (violet) and IC 1613 (blue). The high end of the temperature scale in IC 1613 is not well constrained, hence marked with a dotted line.
Current usage metrics show cumulative count of Article Views (full-text article views including HTML views, PDF and ePub downloads, according to the available data) and Abstracts Views on Vision4Press platform.
Data correspond to usage on the plateform after 2015. The current usage metrics is available 48-96 hours after online publication and is updated daily on week days.
Initial download of the metrics may take a while.