| Issue |
A&A
Volume 551, March 2013
|
|
|---|---|---|
| Article Number | A74 | |
| Number of page(s) | 13 | |
| Section | Stellar atmospheres | |
| DOI | https://doi.org/10.1051/0004-6361/201219977 | |
| Published online | 25 February 2013 | |
Online material
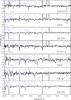 |
Fig. 4a
GTC-OSIRIS spectra of OB-type stars in IC 1613. The spectra have been rebinned to 3 pixels and corrected by each star’s radial velocity, except for 71 708, for which we used IC 1613’s systemic velocity −234 km s-1 (Lu et al. 1993). The evolution of HeII4541/HeI4471 is clearly seen. |
| Open with DEXTER | |
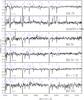 |
Fig. 4b
continued. |
| Open with DEXTER | |
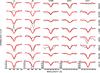 |
Fig. 6
Best fit FASTWIND model (red) to the sample stars (black). The chart shows the principal diagnostic spectral lines, as in Fig. 5. Stellar identification numbers are provided on the right-hand side of the plot. Axes are only provided for the bottom target for clarity’s sake; the same axes are used for the remaining stars. |
| Open with DEXTER | |
Appendix A: Finding charts for the sample stars
Finding charts for the newly identified OB stars are provided in this section. The images were taken with the Wide Field Camera (WFC) at the 2.5 m Isaac Newton Telescope (INT); for more details see GHV09. All the identification charts show a field of 2′ × 2′, observed with broad Harris V-band filter.
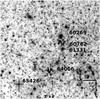 |
Fig. A.1
Stars 60269 (B0.5 I), 60782 (O9.5 III), 61331 (O9.7 II), 64066 (O3 III((f))) and 65426 (O6 III). |
| Open with DEXTER | |
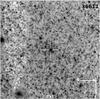 |
Fig. A.2
Star 36611 (O7 III-V). |
| Open with DEXTER | |
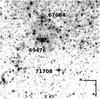 |
Fig. A.3
Stars 67684 (O8.5 I), 69476 (O6.5 III) and 71708 (late-O III+neb). |
| Open with DEXTER | |
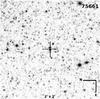 |
Fig. A.4
Star 75661 (O8 III). |
| Open with DEXTER | |
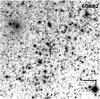 |
Fig. A.5
Star 60882 (B0.5 I-III). |
| Open with DEXTER | |
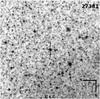 |
Fig. A.6
Star 27381 (B1-1.5 I). |
| Open with DEXTER | |
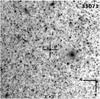 |
Fig. A.7
Star 35071 (B2.5 III). |
| Open with DEXTER | |
© ESO, 2013
Current usage metrics show cumulative count of Article Views (full-text article views including HTML views, PDF and ePub downloads, according to the available data) and Abstracts Views on Vision4Press platform.
Data correspond to usage on the plateform after 2015. The current usage metrics is available 48-96 hours after online publication and is updated daily on week days.
Initial download of the metrics may take a while.