Free Access
Fig. 6
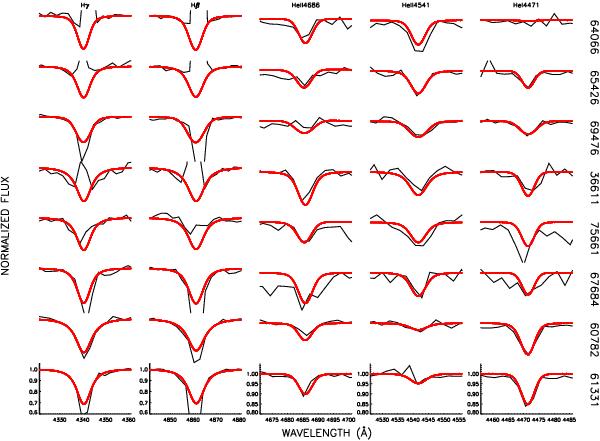
Best fit FASTWIND model (red) to the sample stars (black). The chart shows the principal diagnostic spectral lines, as in Fig. 5. Stellar identification numbers are provided on the right-hand side of the plot. Axes are only provided for the bottom target for clarity’s sake; the same axes are used for the remaining stars.
Current usage metrics show cumulative count of Article Views (full-text article views including HTML views, PDF and ePub downloads, according to the available data) and Abstracts Views on Vision4Press platform.
Data correspond to usage on the plateform after 2015. The current usage metrics is available 48-96 hours after online publication and is updated daily on week days.
Initial download of the metrics may take a while.