Fig. 1
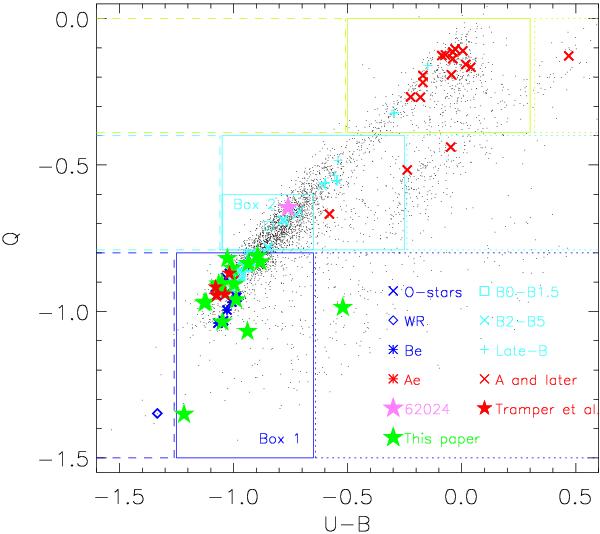
IC 1613’s U − B vs. Q diagram. Black dots mark catalogue stars with high-quality photometry from GHV09. Other colours and symbols, except for filled stars, mark the position of stars with known spectral types from Bresolin et al. (2007). O- and early-B-stars are concentrated in boxes 1 and 2. The pink star represents 62 024, an Of star analysed by Herrero et al. (2012). Red stars represent the sample of Tramper et al. (2011) in IC 1613. Green stars mark this paper’s targets.
Current usage metrics show cumulative count of Article Views (full-text article views including HTML views, PDF and ePub downloads, according to the available data) and Abstracts Views on Vision4Press platform.
Data correspond to usage on the plateform after 2015. The current usage metrics is available 48-96 hours after online publication and is updated daily on week days.
Initial download of the metrics may take a while.