| Issue |
A&A
Volume 548, December 2012
|
|
|---|---|---|
| Article Number | A96 | |
| Number of page(s) | 13 | |
| Section | Planets and planetary systems | |
| DOI | https://doi.org/10.1051/0004-6361/201219622 | |
| Published online | 29 November 2012 | |
Photophoresis of dust aggregates in protoplanetary disks
Technische Universität Braunschweig, Institut für Geophysik und
extraterrestrische Physik,
Mendelssohnstraße 3,
38106
Braunschweig,
Germany
e-mail: This email address is being protected from spambots. You need JavaScript enabled to view it.
Received: 16 May 2012
Accepted: 28 September 2012
Abstract
Aims. Photophoretic motion of dust agglomerates can play a role for the re-distribution and mixing of material in protoplanetary disks. The dust agglomerates can consist of various materials and may possess a variety of morphologies and sizes. This experimental study intends to investigate the influence of different dust materials and dust aggregate sizes on the photophoretic motion.
Methods. Dust agglomerates were subjected to different light intensities and their respective photophoretic motion was observed under microgravity conditions and in a rarefied gas.
Results. The measured velocities for dust aggregates are on average proportional to the size of the dust aggregate, vary largely with material, and for a given material the velocity distribution for a single dust aggregate size is very broad and can be described by a Gaussian with a width comparable to its mean velocity. Remarkably, a fraction of a few 10 percent of all particles investigated exhibit a motion in the opposite direction. The mean photophoretic velocity of dust aggregates can be explained by the model of Beresnev et al. (1993, Phys. Fluids, 5, 2043) with a surprisingly high value for the ratio of heat conductivity to the asymetry factor of λ/J1 0.1 W/m/K. Earlier work on photophoretic particle transport in protoplanetary disks assumed values of λ/J1 0.001 W/m/K so that the real transport efficiency should me much lower and the corresponding timescale much longer.
Key words: protoplanetary disks / methods: laboratory
© ESO, 2012
1. Introduction
1.1. Protoplanetary disks
Protoplanetary disks are gaseous disks around young stars and are the places where planetesimals form through the agglomeration of micrometre-sized dust grains to increasingly larger agglomerates (Güttler et al. 2009; Zsom et al. 2010). Protoplanetary disks evolve into debris disks over the timescale of a few Myr (Wyatt 2008), and frequently the opening of an inner gap within these disks is observed (e.g. Besla & Wu 2007; Hughes et al. 2010). As a consequence, debris disks become optically thin at their inner edge, which subsequently moves outward. While the processes responsible for the broadening of the gap and aging of the disk are not yet fully understood, one of the processes proposed to be responsible for at least part of this widening is photophoresis (Herrmann & Krivov 2007). Besides the classical drift motions of grains in a protoplanetary disk due to gas friction (Weidenschilling 1977a), Krauss et al. (2007) and Mousis et al. (2007) recently proposed that photophoresis can have an impact on the dust motion in the radial direction at the inner, illuminated (i.e. low optical depth) edge of the protoplanetary disk. Infrared emission of the protoplanetary disk itself might also lead to a photophoretic effect, which pushes particles away from the midplane (Wurm et al. 2010). To evaluate the importance of photophoresis for the above-mentioned systematic motions of dust aggregates in protoplanetary and debris disks, we performed microgravity experiments in which we measured the photophoretic velocity of dust aggregates of various sizes and compositions.
1.2. Photophoresis
Photophoresis is an effect, which is based on the interaction of solid particles with light and gas (see Fig. 1 for a sketch).
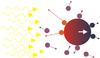 |
Fig. 1 Sketch of the principle of the photophoretic effect, showing the interaction of a solid particle with irradiation and the ambient gas. See text for details. |
Due to the (partial) absorption of the incoming light, a temperature gradient is established within the dust particle. Gas molecules, when colliding with the dust grain, can accommodate on the particle and obtain the (local) surface temperature of the dust grain. When re-emitted, the gas molecules exchange a higher momentum with the dust particle on the warmer than on the opposite, cooler side. This asymmetry results in a motion of the dust grain with its cooler hemisphere leading and its warmer side trailing. For materials with a high absorption coefficient, the solid particles thus move away from the light source. Photophoresis has already been described in the 19th century by Reynolds (1879) and Maxwell (1878). In the 1970s and 1980s, photophoresis was investigated in the context of atmospheric transport of aerosol particles (see e.g. Rohatschek 1985). Beresnev et al. (1993) derived an expression for the photophoretic force acting on a dust particle in the limit of complete accomodation of the molecules (i.e. no specular reflection) and large Knudsen numbers (i.e. in a rarefied gas)  (1)Here, pg, I, J1, rp, λp, ϵ, and mg are the ambient gas pressure, the intensity of the illumination, the asymmetry factor (see Beresnev et al. 1993, for more details), the radius of the dust particle, its thermal conductivity, its emissivity (for which we assume in the following analysis a value of ϵ = 1), and the mass of the gas molecules, respectively. The quantities σ and k are the Stefan-Boltzmann and the Boltzmann constant, respectively. The asymmetry factor J1 describes the non-uniformity of the light absorption of the particle. Its value range is −0.5 ≤ J1 ≤ 0.5, depending on the optical properties of the particle. For a negative value of J1, positive photophoresis dominates for which the particle motion is in the direction of light (see above), whereas for positive J1 values, negative photophoresis is observed. In the latter case, the particle will heat at its rear side such that it moves towards the light source.
The terms in the denominator of Eq. (1) can be attributed to three characteristic physical effects. The first term, λpT/rp, is intrinsic to the particle, relating its photophoretic motion to the particle’s heat conductivity. The higher the heat conductivity, the lower the temperature difference across the particle and, hence, the lower the photophoretic force. The second, radiative term, 4ϵσT4, becomes important at elevated temperatures when the (re-)radiation of energy by the particle becomes more efficient. The third term,  , is a momentum diffusion term, which becomes important at low Knudsen numbers, i.e. at high gas pressures. The Knudsen number is given by Kn = λmfp/rp, with λmfp being the mean free path of the gas molecules. For pressures around 100 Pa (1000 dyn/cm2, equivalent to radial distances in a MMSN of 0.2 AU) and particles in the micrometre size regime (both values relevant for protoplanetary disks), the first term dominates the denominator by one to two orders of magnitude; the diffusion term starts to reach the same order of magnitude as the heat-conductivity term for particles of a few hundred micrometres radius with low thermal conductivities.
The frictional interaction between dust particles and the ambient gas is described by the response time of the dust particle to a gas motion, τp. Solid particles with an initial relative velocity with respect to the gas couple to the gas motion within a few response times. In the free molecular flow limit, this friction time can be calculated with the help of the Epstein drag law (Epstein 1924),  (2)Here, ϱp is the particle mass density, ϱg is the mass density of the gas, and vg is the average molecular velocity. Using the relation between force and velocity in the terminal case,
  (3)and assuming an ideal gas, one gets an expression for the photophoretic velocity of dust particles in the free molecular flow regime
 ![Mathematical equation: \begin{equation} v_{\rm ph} = \frac{I\cdot v_{\rm g} \cdot J_1}{12}\cdot \left[\frac{\lambda_{\rm p} T}{r_{\rm p}} + 4\epsilon\sigma T^4 + p_{\rm g}\sqrt{\frac{2kT}{\pi m_{\rm g}}}\right]^{-1}\cdot \label{eq:vph_full} \end{equation}](/articles/aa/full_html/2012/12/aa19622-12/aa19622-12-eq28.png) (4)While the heat conductivity for dust aggregates with complex morphologies is not directly accessible to measurements on a free particle, Eq. (4) allows to derive the heat conductivity by measuring the photophoretic velocity. Laboratory experiments have recently shown that dust layers possess heat conductivity values between λp ≈ 10-3 W m-1 K-1 and λp ≈ 10-1 W m-1 K-1, depending on the packing density of the dust particles in the layer (Krause et al. 2011), whereas solid dust materials possess heat-conductivity values of typically λp ≈ 1−10 W m-1 K-1.
(4)While the heat conductivity for dust aggregates with complex morphologies is not directly accessible to measurements on a free particle, Eq. (4) allows to derive the heat conductivity by measuring the photophoretic velocity. Laboratory experiments have recently shown that dust layers possess heat conductivity values between λp ≈ 10-3 W m-1 K-1 and λp ≈ 10-1 W m-1 K-1, depending on the packing density of the dust particles in the layer (Krause et al. 2011), whereas solid dust materials possess heat-conductivity values of typically λp ≈ 1−10 W m-1 K-1.
Rohatschek (1995) arrived at two separate expressions for the photophoretic force, depending on the Knudsen number. For the Epstein gas drag regime, i.e. for Kn ≫ 1, he gets  (5)with αth being the thermal accommodation coefficient, whereas for the continuum regime, i.e. for Kn ≪ 1, the photophoretic force is given by
  (6)with the the constant D depending only on the ambient gas and not the particle properties through
  (7)with the η, vg and κ being the gas viscosity, the mean molecular velocity of the gas molecules, and the thermal creep coefficient of the gas, respectively. While Eq. (5) from Rohatschek (1995) corresponds to the photophoretic force of Beresnev et al. (1993) (see Eq. (1)) with the first term in the denominator dominating and αth = 1, the expression for the photophoretic force of Beresnev et al. (1993) and Rohatschek (1995) disagree for high Knudsen numbers.
For the transition region between the Epstein and the Stokes gas-drag regimes, Rohatschek (1995) uses the empirical interpolation formula by Hettner (1928),  (8)Assuming for the protoplanetary disk a minimum mass solar nebula model, as first suggested by Weidenschilling (1977b) and Hayashi et al. (1985), the photophoretic velocity of the dust particles for a transparent nebula can be calculated as a function of the radial distance from the central star. Here, we assume that the light intensity from the central star reaches the dust particles un-attenuated; for protoplanetary disks, this is valid only for the inner edge of the disk or for the optically thin regions of the disk atmosphere (and for radiation with sufficiently long wavelength so that the whole disk is optically thin, a case which we do not treat here). For the central star, we assume a light source identical to the present Sun. We apply the formula by Beresnev et al. (1993) (Eq. (1)) for the photophoretic force and, hence, Eq. (4) for the photophoretic velocity.
In Fig. 2 we show the results of these calculations for particle radii between rp = 5 × 10⁻⁷ m and rp = 1 × 10⁻³ m (see insets in Figs. 2a−d), for four different heat conductivities of the dust particles, i.e. λp = 10-3 W m-1 K-1 (Fig. 2a), λp = 10-2 W m-1 K-1 (Fig. 2b), λp = 10-1 W m-1 K-1 (Fig. 2c), and λp = 1 W m-1 K-1 (Fig. 2d), and for J1 = −0.5. Mind that the velocities shown in Fig. 2 assume a steady-state disk of the minimum mass solar nebula with an optically thin inner gap in the disk according to the distance given in the abscissa. Moudens et al. (2011) carried out a detailed theoretical analysis of particle motion within an evolving disk, taking into account gas density, opacity changes and turbulence which result in different equilibrium radial positions of particles of different sizes. Thus, a the size dependence of the velocities at a given radial position cannot be easily inferred so that a comparison of their velocities to ours is not possible, albeit photophoretic velocities are in the expected range.
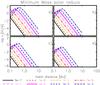 |
Fig. 2 Photophoretic velocities of dust aggregates of various radii (labeled curves with radii given in metres) in the midplane of a transparent minimum mass solar nebula as given by Eq. (4). Panels a) to d) show the results for heat conductivities of the dust aggregates of λp = 10-3 W m-1 K-1, λp = 10-2 W m-1 K-1, λp = 10-1 W m-1 K-1, and λp = 1 W m-1 K-1, respectively. The luminosity of the central star is assumed to be equal to the solar luminosity, and J1 = −0.5. |
2. Previous work
Beresnev et al. (1993) carried out photophoretic experiments on well-defined spherical particles by means of a torsion balance. In the context of atmospheric aerosol properties, Rohatschek (1995) conducted experiments on aluminium agglomerates which show quite a variation of the photophoretic effect for different agglomerate specimens, though this variation was not characterized. Microgravity experiments with porous dust aggregates consisting of black silica particles of the same type as used in this work were carried out by Steinbach et al. (2004). They found an increasing mean photophoretic velocity and a broadening of the velocity distribution function with increasing aggregate size. Photophoresis was proposed by Krauss & Wurm (2005) and Wurm & Krauss (2006a) to possibly play a role for the motion of dust agglomerates within the inner parts of a protoplanetary disk. Photophoresis as a possible explanation for the size-sorting of chondrules was also proposed (Wurm & Krauss 2006b). Measurements of the photophoretic motion for a few chondrules show that photophoresis can in principle work as a source of velocity for chondrules, given a sufficiently intense radiation field (Wurm et al. 2010).
3. Experimental approach and samples
As can be seen in Fig. 2, the expected photophoretic velocities are quite small if the particle sizes are small (for Kn > 1) or the heat conductivities are large. In order to be accessible to experiments, an environment that guarantees sufficiently small external velocities and a sufficiently long observation time is required. We therefore performed our experiments under microgravity conditions in the Bremen drop tower, which allows experiment durations of 4.7 s and residual accelerations smaller than 10-4 m s-2. A schematic overview of our experimental setup is depicted in Fig. 3a.
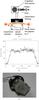 |
Fig. 3 Experimental setup for measuring the photophoretic motion of small dust aggregates. a) Sketch of the overall experimental setup. b) Intensity profile of the laser beam used in the experiments. c) Vibrating sieve as an injector of dust aggregates for the experiments with large dust aggregates. Experiments with small dust particles used a cogwheel-type dust injector, as shown in a). |
A dust injection device is mounted on the top of a vacuum chamber and allows for gravity-assisted injection of the dust particles or aggregates into the observational volume right before the release of the drop capsule into free fall. Depending on the desired dust-aggregate size, either a cogwheel-type dust injector for experiments with single dust grains and small dust aggregates (cf. Poppe et al. 1997) or an injector based upon the principle of a vibrating sieve (large dust aggregates) was used (see Fig. 3a). The microgravity phase of the experiment was started after a sufficiently high dust density in the observational volume had been achieved. Below the dust injector, the experimental vacuum chamber is located. Two anti-parallel laser beams (misaligned by an angle of 2 degrees in order to avoid mutual destruction), which were alternately powered, penetrate through the experiment chamber. Their light gives rise to the photophoretic force acting upon the dust aggregates and their anti-parallel arrangement allows for differential measurements of the photophoretic effect for single dust particles and small dust aggregates. This option was not used in the experiments with larger dust aggregates, because the coupling time of the larger dust aggregates to the gas, i.e. the time required to adopt the photophoretic velocity, became comparable to the experiment duration. Two cameras were mounted such that they could observe the motion of the particles within the laser beams. The homogeneity of the laser beams within the observational volume (35 × 17 × 10 mm3) was better than ± 10% deviation from the mean intensity (see Fig. 3b for the beam profile) throughout the observational volume. As laser light sources, we chose two solid-state fibre-coupled diode lasers, operating at a wavelength of 813 nm. Their irradiation intensity could be varied within the observational volume of the experiment in continuous-wave mode from 20 mW cm-2 to 1800 mW cm-2, equivalent to a range in the illumination from 0.15 to 13.0 solar constants or, expressed in distance to the Sun, ranging from 0.28 to 2.6 AU).
We performed two experimental campaigns in the Bremen drop tower with this setup, the first campaign concentrating on small dust aggregates (typical olivine and black-coloured SiO2 aggregate radii 1−20 μm) and the second campaign using dust aggregates with aggregate radii of 25−200 μm (olivine, black-coloured SiO2, and transparent (white) SiO2). Figure 4 shows the cumulative size distributions of the dust aggregates for both campaigns. Three different dust materials were used within the scope of this study, two types of monodisperse spherical silica particles (transparent SiO2 spheres with 0.5 μm radius (Fig. 5c) and black-coated SiO2 spheres with 0.75 μm radius (Fig. 5a)) as well as irregular-shaped olivine grains with a radius distribution of 0.5−15 μm (see Fig. 5b). The transparent silica spheres are physically well characterized; a summary of their properties can be found in Blum et al. (2006). The black-coated silica spheres are manufactured from the same material but were additionally coated with a black organic colour (Steinbach 2004, Sudan black). The olivine particles are of the well-studied San-Carlos type. Characterization of this olivine type can e.g. be found in Kanamori et al. (1968), Ahrens (1995) or Abramson et al. (1997).
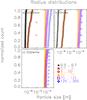 |
Fig. 4 Cumulative distributions of particle and aggregate radii for the three different particle materials and the different experiment types performed in the two microgravity drop-tower campaigns. a) Black SiO2 (monomer radii 0.5 μm). b) Olivine (monomer radii 0.5−15 μm). c) Transparent SiO2 particles (monomer radii 0.75 μm). The different symbols and colours indicate the size distributions generated by the cogwheel injection (around 1 μm) and by the vibrating sieve injection with different mesh sizes, respectively (units in μm, see inset). |
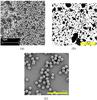 |
Fig. 5 Monomer-particle types used for the photophoresis experiments. a) Monodisperse spherical black SiO2 particles with radii of 0.5 μm (silica spheres coated with a black organic colour, adopted from Steinbach 2004). b) Irregular San-Carlos olivine particles with a radius distribution of 0.5−15 μm. c) Monodisperse spherical transparent SiO2 particles with radii of 0.75 μm. A scale bar of 10 μm length is shown in each sub-figure. |
During the two drop-tower campaigns, dust aggregates in various size ranges were used (see Fig. 4), which were injected into rarefied air at different residual pressures and which were exposed to laser-light illuminations of different intensities. A summary of all experimental parameters is given in Table 1. Experiments with small dust aggregates allowed measurements with different light intensities during one free-fall flight, owing to their short coupling times (≈ 10 ms), whereas the longer coupling times of the large dust aggregates (1 s) and the limited number of free-fall experiments allowed the use of one light intensity per experiment only. The gas pressure during an experiment was kept constant within the measurement uncertainties.
Summary of the experimental parameters in the 19 drop-tower experiments.
3.1. Small dust aggregates
The experiments performed with small dust agglomerates (≤ 20 μm radius) allowed to measure the photophoretic force differentially (i.e. with alternating laser beams as described above), due to the short coupling time of the particles to the gas. In each experiment, the direction of the laser beam was reversed three times, allowing for four independent measurements of the photophoretic velocity of one second duration each. The experiment chamber was mounted on a slowly rotating centrifuge, which allows to superimpose a slow but steady drift motion of the particles with velocity vd such that this drift motion is perpendicular to the photophoretic motion. Assuming terminal velocity and free molecular flow (i.e. for Kn ≫ 1), the drag force  exactly balances the centrifugal force Fω = mdω2r, and we can obtain the (aerodynamical) radius of the particles by measuring the drift velocity perpendicular to the photophoretic motion. Here, ω,
  and r are the angular velocity of the centrifuge, the mass of the dust particle, and the radial distance of the experimental volume from the rotational axis of the centrifuge.
3.2. Large dust aggregates
In the experiments with the larger (~100 μm) dust aggregates, a direct measurement of the particle sizes, and thus masses, was possible, due to a sufficient magnification of the camera optics, which allows to spatially resolve individual dust aggregates. Thus, we did not use the centrifuge in the experiments with the large dust aggregates.
4. Data analysis
The data obtained during the drop-tower experiments comprise image sequences of the dust-aggregate motion within the intensity field of the photophoretic illumination and (for experiments with small dust aggregates) due to the centrifugal drift. In order to obtain the velocities of the dust aggregates, the DaViS 7 particle shadowgraphy software as well as self-written IDL routines were used. Images were background corrected and particle detection was done by a three-step adaptive thresholding. Subsequently, the tracking software provided particle matching, sizes and velocities on an image-pair basis so that the whole trajectories could be constructed from the image sequences.
The analysis for the small (radii ≤ 20 μm) and large dust agglomerates (radii ≥ 50 μm) differs due to their coupling time relative to the gas and the experiment observation time and will be described in the following.
4.1. Small dust aggregates
In the case of small dust aggregates, whose coupling times to the gas were much shorter than the duration of a steady laser-light illumination, the particles can be assumed to be always perfectly coupled to the gas and travel at terminal velocity. This allows to fit particle positions with a constant velocity in both mutually perpendicular directions, owing to the photophoretic motion and to the centrifugal drift motion, respectively. Furthermore, the rapid coupling to the gas allows to carry out several measurements during one drop-tower experiment, each lasting 1 s by reversing the light direction (and in some cases also the light intensity) with respect to the preceding sequence.
4.2. Large dust aggregates
For large dust agglomerates, their visual cross-section was directly measured from the images and their mass was determined based on the assumption that the dust aggregates possess a packing density of φ = 0.35 (cf. Weidling et al. 2012) and that the two-dimensional radius rp as derived from the visual cross-section is also representative for the third dimension. We then obtain for the dust-aggregate mass 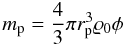 (9)with ϱ0 being the mass density of the bulk dust material.
For further analysis, only particles with a trajectory longer than 20 data points were considered. As the coupling times to the gas can be on the order of the duration of the free-fall time of the experiment, the larger dust aggregates often do not reach terminal velocity within the observation time. Thus, the observed one-dimensional trajectories in the direction of light x(t) were fitted with a 2nd order polynomial  (10)which gives the measured acceleration a0 acting on the particle and the momentary velocity v0. This acceleration was then used to derive the terminal photophoretic velocity and the photophoretic acceleration from the balances of the photophoretic force and the frictional force, given the known particle size and ambient gas pressure (see below). In addition, each trajectory was also fitted with a linear function
  (11)which directly yields the photophoretic velocity. For trajectories longer than 50 data points, only the last 50 data points were used. As long as at least 20 data points remained, the fits were iteratively improved by removing single outlier data points which were off by more than 3 sigma from the fit to the trajectory.
From the resulting linear and polynomial fits, the one with the better reduced chi square value was used for further analysis to derive the photophoretic acceleration and velocity. Only tracks with a goodness of fit given by χ2 ≤ 0.35 were considered. This was checked for validity by a randomly chosen subset of particles (approximately 10% of the total amount of data), which did not return any false result, due to, e.g., a close encounter between two particles and a subsequent misidentification of a particle.
Two typical trajectories of a large dust aggregate are shown in Fig. 6.
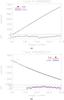 |
Fig. 6 Typical trajectories of large dust aggregates. The measured position data and the linear (red) and 2nd order polynomial (blue) fits are shown. In a), the linear fit is better when comparing the goodness of fit by the reduced mean chi square value, in b) the 2nd order polynomial fit is better, as shown by the residuals in the respective bottom graphs. |
4.2.1. Linear fit
A linear fit is the best fit when a dust aggregate moves at terminal velocity and the acceleration of the photophoretic effect is perfectly balanced by the Stokes friction with the ambient gas for large particles. This means that the observed velocity equals the photophoretic velocity and the photophoretic acceleration is directly obtained via the force balance, ![Mathematical equation: \begin{eqnarray} && 0 = F_{\rm ph} + F_{\rm fric}\\[3mm] && a_{\rm ph} = \frac{6\pi\eta v_{\rm ph} r_{\rm p}}{m_{\rm p}}\cdot \end{eqnarray}](/articles/aa/full_html/2012/12/aa19622-12/aa19622-12-eq104.png) \arraycolsep1.75ptThus, as the photophoretic velocity vph was measured directly and as the particles radius rp and mass mp were given, the particle’s photophoretic acceleration aph can be directly derived using the above equation.
\arraycolsep1.75ptThus, as the photophoretic velocity vph was measured directly and as the particles radius rp and mass mp were given, the particle’s photophoretic acceleration aph can be directly derived using the above equation.
4.2.2. Polynomial fit
The 2nd order polynomial fit is typically the better fit when the particle has not yet reached constant photophoretic velocity and still accelerates or decelerates. Then, the following equations can be used:  \arraycolsep1.75ptFrom the measured dust-aggregate trajectories, the momentary velocities v0 and accelerations a0 were obtained by fitting a 2nd order polynomial to the position data. Knowing the size and, thus, the friction force acting on the particle (again assuming a Stokes drag law), the photophoretic acceleration aph can be calculated. From this, in turn, the terminal (photophoretic) velocity can be calculated for the given ambient gas pressure.
4.3. Binning to allow statistical analysis
After the photophoretic properties of the individual particles were obtained, the particles were binned into distinct size, gas pressure and laser-light intensity intervals in order to allow investigation of the ensemble behaviour.
5. Results and interpretation
5.1. Intensity and pressure dependence of the photophoretic velocity
From the work by Beresnev et al. (1993) and Rohatschek (1985), we expect a linear dependence of the photophoretic velocity with the irradiation intensity (see Eq. (4)). Our data are in agreement with this, as can be seen in Fig. 7; it displays the photophoretic velocity of the black SiO2 particles as a function of the light intensity for all dust aggregate sizes investigated. Figure 7a depicts the median value of the measured photophoretic velocity for various particle size ranges, as indicated in the inset. Figure 7b shows the intensity dependence of the width of the velocity distribution for the same particle size ranges (see Sect. 5.2 for the definition of the width). Figure 7c compares the results from Figs. 7a and b. The solid line in Figs. 7a and b shows the expected linear dependence between photophoretic velocity and light intensity. Although the scatter is quite large, the linear trend is visible for both velocities and the correlation between the median velocity and the width of the velocity distribution is good, albeit the width is a factor of two higher.
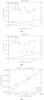 |
Fig. 7 Dependence of the photophoretic velocity for different illumination intensities. a) Intensity dependence of the median of the photophoretic velocity distribution for the indicated size range for black-coloured silica particles (all sizes in μm). The solid black line indicates the slope as expected by theory (arbitrary offset). b) Intensity dependence of the width of the photophoretic velocity distribution for the indicated size range for black-coloured silica particles (all sizes in μm). The solid black line indicates the slope as expected by theory (arbitrary offset). c) Relation between the median velocity and the width of the velocity distribution for the black-colored silica particles. The typical error for the single data points is indicated in figure a). |
We also tested the gas-pressure dependence of the photophoretic velocity at 20 Pa and 100 Pa gas pressure (200 and 1.000 dyn/cm2, respectively or (see Fig. 8a) and can confirm that the photophoretic velocity is pressure-independent for low gas pressures, i.e. if the denominator in Eq. (4) is dominated by the first term. A linear fit between photophoretic velocity and gas pressure yielded vph = [(2.13 ± 6.50)·p/100 Pa + (1.27 ± 2.78)] × 10-2 m s-1, which shows that a pressure dependence cannot be confirmed. Figure 8b compares the cumulative size distributions of the subset of dust aggregates chosen for the two pressure regimes in (a). It can be seen that the two size distributions are almost identical.
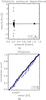 |
Fig. 8 Test for the gas-pressure dependence of the photophoretic velocity. a) Photophoretic velocities of individual black SiO2 dust aggregates for two different gas pressures. The solid line shows a linear fit to the data, which, within the limits of the accuracy of the fit, shows the pressure-independence of the photophoretic velocity. b) The cumulative size distribution of the subset of dust aggregates from a) for the two pressures. |
5.2. Dust-aggregate size dependence of the photophoretic velocity
In order to analyze the dependence of the photophoretic velocity on the dust-aggregate size, we binned our data into dust-aggregate radius and light intensity intervals. Exemplary velocity distributions for these bins are shown in Figs. 9 (black SiO2), 10 (olivine) and 11 (white SiO2). For each of the velocity distribution function, we determined the median value (for which half of the particles are slower and faster) and the width of the distribution. We defined the width as the velocity span of the central 68 percent of the velocity distribution (equivalent to one standard deviation in the case of a Gaussian distribution). The dust-aggregate size dependence of the photophoretic velocity (median and width) is shown in Fig. 12 for black SiO2 and olivine. For both materials and for both determination methods of the photophoretic velocity, we can clearly see a linear increase of the photophoretic velocity with increasing dust-aggregate size, as predicted by Eq. (4). For comparison, theoretical expectations, following Eqs. (5), (6) and (8) are also plotted as solid gray lines. The three curves were calculated, using the general friction coefficient given in Friedlander (2000) (his Eq. (2.20)), for an illumination intensity of 1 W cm-2, for a gas pressure of 100 Pa (1000 dyn/cm2), and for |λp/J1| = 0.1,1 and 10 W m-1 K-1. Brownian motion can only contribute to velocities below the blue line.
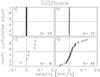 |
Fig. 9 Examples of cumulative photophoretic velocity distribution functions for black SiO2 and for different dust-aggregate radii and radiation intensities. a) Monomers at 0.2−0.3 W cm-2. b) Monomers at 1.0−1.1 W cm-2. c) Aggregates of 125−300 μm radius at 0.2−0.4 W cm-2. d) Aggregates of 125−300 μm radius at 1.0−1.1 W cm-2. |
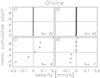 |
Fig. 10 Examples of cumulative photophoretic velocity distribution functions for olivine and for different dust-aggregate radii and radiation intensities. a) Small aggregates of 1.6 μm ± 0.75 μm radius at 0.8 W cm-2. b) Small aggregates of 1.6 μm ± 0.75 μm radius at 1.0 W cm-2. c) Large aggregates of 70−125 μm radius at 0.6 W cm-2. d) Large aggregates of 70−125 μm radius at 1.0 W cm-2. |
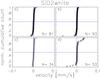 |
Fig. 11 Examples of cumulative photophoretic velocity distribution functions for white SiO2 and for different dust-aggregate radii and radiation intensities. a) Aggregates of 50−70 μm radius at 1.12 W cm-2. b) Aggregates of 50−70 μm radius at 1.47 W cm-2. c) Aggregates of 70−125 μm radius at 1.12 W cm-2. d) Aggregates of 70−125 μm radius at 1.47 W cm-2. |
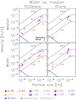 |
Fig. 12 The photophoretic velocities of black SiO2 and olivine dust aggregates as a function the dust-aggregate radius. a) and c) show the results of black SiO2 for the median velocity and the width of the velocity distribution, respectively. b) and d) show the results of olivine for the median velocity and the width of the velocity distribution, respectively. Theoretical curves, following Eq. (4), are shown for an illumination intensity of 1 W cm-2, for a gas pressure of 100 Pa (1000 dyn/cm2), and |λp/J1| = 0.1,1,10 W m-1 K-1. Brownian motion can only contribute to velocities below the blue line. An error estimate for the single data points is indicated in figure a). |
5.3. Heat conductivity and comparison with models
As we have seen above, one of the primary factors influencing the photophoretic velocity, which is not immediately accessible to direct measurements, is the heat conductivity of the particles (λp Eq. (4)). In Fig. 12, we plotted theoretical photophoretic velocity curves of constant |λp/J1| and can derive no clear trend of decreasing heat conductivity with increasing dust-aggregate radius for both dust materials which is expected at least for the transition between monomer grains (λp ~1 W m-1 K-1) and large dust aggregates (λp ~ 10-2 W m-1 K-1; see Krause et al. 2011; and Gundlach et al. 2012). In the case of monomers or small dust aggregates, all single constituents of the aggregate are illuminated. Thus, the thermal gradient within a small dust aggregate is mostly determined by the bulk properties of the material. The larger the dust aggregates become, the more single grains of it are shadowed. The heat transport within the dust aggregate then has to pass through the small joints between the single particles of the dust aggregates, reducing the effective heat flow within the aggregates in comparison to a similarly-sized bulk particle. Measurements of large porous dust samples have shown that typical heat conductivities are on the order of λp ~ 10-2 W m-1 K-1 (see Krause et al. 2011; and Gundlach et al. 2012). Our derived heat conductivities for the largest dust aggregates in our sample do not agree with these measurements, whereas the heat conductivities found for the small dust agglomerates are close to the expected values for the bulk material.
One possible explanation for the deviation between expected and measured photophoretic velocities in our large-aggregate samples can be given by the solid-state greenhouse effect, which leads to a heating of the dust agglomerates not on their surface, but slightly below it. Experiments by Wurm et al. (2010) suggest that the depth of the highest temperature is a few 10 μm below the illuminated surface. Thus, the internal heat gradient responsible for the photophoretic effect within the larger dust agglomerates is possibly smaller than for particles absorbing ideally at their surface. A reduced photophoretic effect would be the consequence.
5.4. The photophoretic velocity distribution in detail
One fact becomes vividly apparent when reviewing the results presented above: a large scatter in the data is observed for all velocity measurements. This means that for a given dust-aggregate size, gas pressure and light intensity, the photophoretic velocity does obviously not obtain a unique value, but follows some distribution curve (see also the qualitative description of that finding in Rohatschek 1985, and the cumulative photophoretic velocity distributions shown in Figs. 9−11). The position and, thus, the velocity measurements of a single dust particle or aggregate are much too accurate to account for this effect.
Figure 12 shows a comparison of the observed photophoretic velocity and the expected values according to Eq. (4) as a function of dust-aggregate size. While the data points shown in the figure are averaged over a certain size bin, the width of the size bin (cf. Fig. 4) is much smaller than the width of the corresponding velocity distribution so that the spread in dust-aggregate sizes cannot explain the spread in photophoretic velocities.
Assuming a Gaussian velocity distribution within any given bin, we can normalize the distributions to a uniform width in order to be able to compare principle differences in the photophoretic velocity as a function of dust-aggregate size or light intensity Fig. 13 shows such a normalization for which all velocities curves were normalized such that the median value is zero and the central 68 percent (corresponding to one standard deviation for a Gaussian distribution) of the velocities are within the normalized velocity range from −1 to 1. Individual curves can deviate from a Gaussian as much as ~± 10%. The mean normalized velocity curve fit the Gaussian much better and deviate from it by less than ~± 5%.
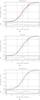 |
Fig. 13 Normalized velocity distributions for the three dust materials. a) Black SiO2. b) Olivine. c) White SiO2. Dotted curves indicate individual velocity distributions; the red solid curve is the mean of all curves for a given material; for comparison, a Gaussian of the same normalized width is shown as blue solid curves. Below the three panels, the deviation of the mean distribution from the Gaussian is shown. |
If we consider the 2.3%, 15.9%, 84.1% and 97.7% quantiles of the photophoretic velocity distributions, which indicate the lower and upper boundaries of intervals containing 68% (one standard deviation) and 95% (two standard deviations) of the velocities around the median value, we find that these velocity values follow also the theoretically predicted photophoretic velocity curves (Eq. (4)). However, the absolute velocities for these quantiles differ considerably (see Fig. 14). As basically all velocity values for the 2.3% and 15.9% quantiles are negative (with the exception of two positive velocities for these quantiles), their absolute value is shown in Fig. 14. This means that about 16% of all measured photophoretic velocities are negative, independent of dust-agglomerate size or radiation intensity. For a comparison between the different measurements, photophoretic velocities were converted to the corresponding value of the light intensity of 1 W cm-2.
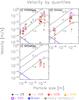 |
Fig. 14 The 2.1%, 15.9%, 50.0%, 84.1% and 97.7% quantiles of the photophoretic velocity distributions for the three dust materials presented in this study. Note that all 2.1% and 15.9% values shown are negative so that we display their absolute value here. Velocities are normalized to an intensity of 1 W cm-2. The theoretical expectations for the photophoretic velocity for the values of λ/J1 = 1.0, 0.1 and 0.01 are indicated by the solid gray lines, the solid blue line indicates the upper boundary of the motion which could be attributed to Brownian motion. |
The velocity variations found in our experiments is comparable to those found by Rohatschek (1985), albeit with different materials. There are a few possible explanations for the observed scatter of the individual velocity measurements. (i) The most obvious cause for the velocity differences is a variation in the heat conductivity of the observed dust aggregates. Monomers and very small agglomerates are expected to exhibit photophoretic velocities with the heat conductivity of the bulk material. In bigger dust agglomerates, not all single monomers are illuminated so that the effective heat conductivity of the agglomerate is additionally influenced by the contact area between adjacent monomers within the dust agglomerate, which will conduct heat worse than the bulk material alone. While we do not clearly see such an effect with black silica particles, the olivine agglomerates show a slight reduction in heat conductivity for the larger agglomerates. However, if the width of the velocity distribution is caused by variations in the heat conductivity of the dust aggregates, then the prediction is that for monomers (and small dust aggregates) the width of the velocity distribution should vanish. Obviously, the width is proportional to the median photophoretic velocity (see Fig. 7c) so that this hypothesis is not supported by our finding. (ii) Another explanation might be the occurrence of spatial inhomogeneities of the accommodation coefficient J1 throughout the dust agglomerates so that the heat transfer from the aggregate to the gas is not the same on all sides. The reason for this might be found in differences of the surface properties of the single monomers which constitute the aggregates on a nanometer scale, possibly due to different history. Due to a much larger surface area of the dust aggregate with respect to the single monomer grains, such variations should be relatively less important for larger dust aggregates so that we can disregard this hypothesis for the width of the velocity distribution function. (iii) A third explanation for the observed scatter could in principle be a second order thermophoretic effect. In our experiments, the overall dust-particle mass density is much higher than the gas density in the initial part of the experiment. A second order thermophoretic effect means that the large amount of solid particles heats the gas such that the gas temperature in the observation volume is elevated with respect to the surrounding gas, due to the heat transfer from the particles to the gas. As a result of this, one would expect a movement of the dust particles away from the center of the mass concentration of the dust cloud. Given the injection methods used in our experiments, the dust concentration is highest in the center of the vacuum chamber. We tested for asymmetries of the width of the velocity distribution with respect to the position inside the vacuum chamber and could find none. On top of that, the mass density gradient of the dust particles across the observational volume is very low so that we also do not expect a second order thermophoretic effect responsible for the observed velocity width. (iv) Aspects which are not accessible to an individual analysis are related to the detailed morphologies of the dust aggregates. Dust aggregates with the same projected cross section can easily exhibit different internal structures (mainly due to different porosities). These morphological differences can have an impact on the heat conductivity as well as on the coupling time of the particles to the gas and can, thus, lead to the observed scatter in the photophoretic velocities – a variation which can also be expected to be present for dust aggregates in protoplanetary disks. Thus, we expect the photophoresis velocities of protoplanetary dust aggregates to also scatter somewhat due to variations in particle morphology.
5.5. Material dependence
In order to compare the photophoretic behaviour of different dust materials, we extracted sub-samples of the black SiO2, olivine, and white SiO2, respectively and chose the dust-aggregate size and light-intensity such that the resulting size distributions were identical for all three materials, to avoid any influence of the size. We thus chose dust aggregates of 55−80 μm radii. The measured thermophoretic velocities were converted to an illumination intensity of 1 W cm-2 for this comparisons, assuming a proportionality between velocity and light intensity. In Fig. 15, we plot the corresponding cumulative sizes and the resulting photophoretic velocity distributions.
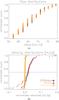 |
Fig. 15 Material dependence of the photophoretic effect. a) Size distributions of the sub-samples of black SiO2 (diamonds), olivine (triangles) and white SiO2 (squares) dust aggregates, respectively. b) The corresponding distributions of the intensity-normalized velocities for the three materials. |
In Table 2 we compile the results of the comparison, i.e. the median photophoretic velocity, the width (measured between the 16% and the 84% quantiles) of the velocity distribution function and the percentage of negative values in the photophoretic motion (see also Sect. 5.6). We can see that both the olivine and the black SiO2 dust aggregates show a considerable photophoretic effect while photophoresis is almost negligible for the white SiO2 dust aggregates. The velocity distribution for olivine shows a considerably larger negative fraction than the velocity distribution of the black SiO2 particles.
5.6. Negative photophoresis
All velocity distributions for all materials show a significant amount of particles that exhibit negative photophoresis (see Figs. 9−11, respectively). The fraction of dust agglomerates, which exhibit a motion in the direction towards the light source, varies from a few percent to ~50 percent of the total particle number of a given sub-sample. A summary table for the velocity distributions like those shown in Figs. 9−11 is given in Table 3.
Properties of all individual velocity distributions from all experiments which are presentend this work and individually analysed.
Negative photophoresis is known to exist for transparent particles, for which the side facing away from the light source can be warmer than the front side. However, as most of the black SiO2 and olivine particle show a clear positive photophoretic effect, we can exclude the classical negative photophoresis as the cause for the particle behaviour found in our study. However, a number of different effects or particle properties can give rise to negative photophoresis. (i) If the morphology of the dust aggregates varies considerably, a different absorption behaviour of the particles can result. Semi-transparent dust aggregates absorb the light at an optical depth of τ ≈ 1; this may be several particle monolayers inside the aggregate so that for certain aggregate sizes also negative photophoresis can occur. (ii) The accommodation coefficient J1 might be anisotropic or vary between different monomers or even monomer parts inside a dust aggregate. Accordingly, one might find single particles which, although uniformly illuminated and heated, will exhibit a photophoretic force in the direction of the side where they have the highest accommodation coefficient. (iii) Rotation of the dust aggregates may lead to a deviation of the observed photophoretic velocity from the light direction. However, it is hard to explain a motion in the anti-light direction with random rotation only.
6. Conclusion and astrophysical implications
In this work, we experimentally investigated the strength of the photophoretic effect for three different dust materials and dust aggregates of various sizes. We found that the photophoretic velocity in the free molecular flow regime is proportional to the light intensity and independent of the gas pressure, as predicted by the models of Beresnev et al. (1993) and Rohatschek (1995). Also following these models, the mean photophoretic drift velocity is increasing with increasing dust-aggregate size. However, the photophoretic motion of an individual dust aggregate can vary considerably with respect to the mean value. The velocity distribution function is roughly Gaussian, with a width proportional to the mean value. For all three materials investigated in our study (black SiO2, olivine, white SiO2), we found a non-negligible fraction of the particles to exhibit a negative photophoretic motion.
In an astrophysical environment, e.g. in a protoplanetary or debris disk, the differences in the photophoretic response of different dust-aggregate materials (Sect. 3), the intrinsically large variation of the photophoretic effect on dust aggregates of otherwise identical properties (Sect. 5.4) as well as the dust-aggregate size dependence of the photophoretic velocity (Sect. 5.3) are all superimposed. Observational evidence as well as laboratory studies suggest that the size distribution found at any given time within a protoplanetary disk may be as small as about two orders of magnitude (Zsom et al. 2010), but still wider than the scatter of the photophoretic effect found in this study. As a result, the different efficiencies of the photophoretic effect for dust aggregates of the same size are even amplified by the (local) size distribution of the dust aggregates. In this light, we do not expect to find anywhere a sharp inner edge in a protoplanetary disks nor a steep density gradient caused by a photophoretic outward drift of material.
It can be rather inferred that a very broad transition region from the optical thin to the optical thick parts of the disk forms, which gradually moves outward, due to the mean positive photophoretic effect. However, caused by the width of the photophoretic velocity distribution and the local size and material distribution of dust aggregates, the width of this transition regime should also increase with time. As a consequence, size sorting by photophoresis is expected to be rather limited.
This would still hold true in the presence of turbulence which is e.g. discussed in Krauss et al. (2007) and found to slow down an outward drift caused by photophoresis due to a reduced net velocity. Especially for small particles (≤ 100 μm) the photophoretic velocities are small and the turbulent motion might thus delay any disk clearing until particles grew to a size where the photophoretic motion becomes strong enough in order to start clearing the inner edge of the disk.
Following our Eq. (4) with the assumption that the first term in the denominator dominates over the other two, one of our results is that for dust aggregates in the sub-mm size regime, the value λ/J1 ≈ 0.1 W/(mK). Comparing these values for the ratio of the dust-aggregates’ heat conductivity and the asymmetry factor with the assumptions of Moudens et al. (2011), i.e. λ/J1 ≈ 0.001 W/(mK), we expect that their results will change quantitatively but not qualitatively: particle transport will be slower and less efficient by up to two orders of magnitude. The calculated time-dependent equilibrium distances for dust aggregates of a given size will be further inward than estimated by Moudens et al. (2011)
The dependence of the strength of the photophoretic effect on the material properties has nevertheless implications on the visible chemical distribution of elements within the disk. This is especially true for the photophoretic effect of dust aggregates
by the infrared radiation of the disk itself (Wurm et al. 2010), which allows for particles to be levitated above the dust sub-disk, due to the disk’s infrared emission. As a consequence, the observed chemical composition of the dust as observed from the outside will become biased by an over-abundance of photophoretically “active” materials; only these materials will remain in the outer layers of a dust disk. At the same time, dust materials that are only weakly susceptible to photophoresis will sediment to the central plane of the disk, giving rise to a chemical and mineralogical separation in the vertical extent of the protoplanetary disk.
Acknowledgments
This work was funded by the Deutsches Zentrum für Luft- und Raumfahrt (DLR) under grant 50WM0936. We also thank DLR for providing us with the drop tower flights and the staff at ZARM for their hospitality during our campaigns.
References
- Abramson, E. H., Brown, J. M., Slutsky, L. J., & Zaug, J. 1997, J. Geophys. Res., 102(B6), 12253 [NASA ADS] [CrossRef] [Google Scholar]
- Ahrens, T. J. 1995, Mineral Physics & Crystallography, Handbook of Physical constants (AGU) [Google Scholar]
- Beresnev, S., Chernyak, V., & Fomyagin, G. 1993, Phys. Fluids, 5, 2043 [Google Scholar]
- Besla, G., & Wu, Y. 2007, ApJ, 655, 528 [NASA ADS] [CrossRef] [Google Scholar]
- Blum, J., Schräpler, R., Davidson, B. J. R., & Trigo-Rodriguez, J. M. 2006, ApJ, 652, 1768 [NASA ADS] [CrossRef] [Google Scholar]
- Epstein, P. S. 1924, Phys. Rev. Lett., 23, 710 [NASA ADS] [CrossRef] [Google Scholar]
- Friedlander, S. 2000, Smoke, Dust, and Haze: Fundamentals of Aerosol Dynamics, 2nd edn. (Oxford University Press) [Google Scholar]
- Gundlach, B., Blum, J., Skorov, Y. V., & Keller, H. U. 2012, Icarus, submitted [arXiv:1203.1808] [Google Scholar]
- Güttler, C., Krause, M., Geretshauser, R. J., Speith, R., & Blum, J. 2009, ApJ, 701, 130 [NASA ADS] [CrossRef] [Google Scholar]
- Hayashi, C., Nakazawa, K., & Nakagawa, Y. 1985, in Protostars and Planets II, eds. D. C. Black, & M. S. Matthews (Univer), 1100 [Google Scholar]
- Herrmann, F., & Krivov, A. V. 2007, A&A, 476, 829 [NASA ADS] [CrossRef] [EDP Sciences] [Google Scholar]
- Hettner, G. 1928, Ergebnisse exakter Naturwissenschaften, 7, 209 [Google Scholar]
- Hughes, A. M., Andrews, S. M., Wilner, D. J., et al. 2010, AJ, 140, 887 [NASA ADS] [CrossRef] [Google Scholar]
- Kanamori, H., Fujii, N., & Mizutani, H. 1968, J. Geophys. Res., 73(2), 595 [Google Scholar]
- Krause, M., Blum, J., Skorov, Y., & Trieloff, M. 2011, Icarus, 214, 286 [NASA ADS] [CrossRef] [Google Scholar]
- Krauss, O., & Wurm, G. 2005, ApJ, 630, 1088 [NASA ADS] [CrossRef] [Google Scholar]
- Krauss, O., Wurm, G., Mousis, O., et al. 2007, A&A, 462, 997 [Google Scholar]
- Maxwell, J. C. 1878, Phil. Trans. R. Soc. London, 231 [Google Scholar]
- Moudens, A., Mousis, O., Petit, J. M., et al. 2011, A&A, 531, A106 [NASA ADS] [CrossRef] [EDP Sciences] [Google Scholar]
- Mousis, O., Petit, J.-M., Wurm, G., et al. 2007, A&A, 466, L9 [NASA ADS] [CrossRef] [EDP Sciences] [Google Scholar]
- Poppe, T., Blum, J., & Henning, T. 1997, Rev. Sci. Instrum., 68, 2529 [NASA ADS] [CrossRef] [Google Scholar]
- Reynolds, O. 1879, Phil. Trans. R. Soc. London, 727 [Google Scholar]
- Rohatschek, H. 1985, J. Aerosol Sci., 16, 29 [CrossRef] [Google Scholar]
- Rohatschek, H. 1995, J. Aerosol Sci., 26, 717 [CrossRef] [Google Scholar]
- Steinbach, J. 2004, Optische Manipulations von Mikropartikeln in dünnen Gasen, Diplomarbeit, Universität Jena [Google Scholar]
- Steinbach, J., Blum, J., & Krause, M. 2004, Eur. Phys. J. E, 15, 287 [Google Scholar]
- Weidenschilling, S. J. 1977a, MNRAS, 180, 55 [Google Scholar]
- Weidenschilling, S. J. 1977b, Astrophys. Space Sci., 51, 153 [NASA ADS] [CrossRef] [Google Scholar]
- Weidling, R., Güttler, C., & Blum, J. 2012, Icarus, 218, 688 [NASA ADS] [CrossRef] [Google Scholar]
- Wurm, G., & Krauss, O. 2006a, Icarus, 180, 487 [NASA ADS] [CrossRef] [Google Scholar]
- Wurm, G., & Krauss, O. 2006b, Phys. Rev. Lett., 96 [Google Scholar]
- Wurm, G., Teiser, J., Bischoff, A., Haack, H., & Roszjar, J. 2010, Icarus, 208, 482 [NASA ADS] [CrossRef] [Google Scholar]
- Wyatt, M. C. 2008, ARA&A, 46, 339 [NASA ADS] [CrossRef] [Google Scholar]
- Zsom, A., Ormel, C. W., Güttler, C., Blum, J., & Dullemond, C. P. 2010, A&A, 513, A57 [NASA ADS] [CrossRef] [EDP Sciences] [Google Scholar]
All Tables
Properties of all individual velocity distributions from all experiments which are presentend this work and individually analysed.
All Figures
|
Fig. 1 Sketch of the principle of the photophoretic effect, showing the interaction of a solid particle with irradiation and the ambient gas. See text for details. |
| In the text | |
|
Fig. 2 Photophoretic velocities of dust aggregates of various radii (labeled curves with radii given in metres) in the midplane of a transparent minimum mass solar nebula as given by Eq. (4). Panels a) to d) show the results for heat conductivities of the dust aggregates of λp = 10-3 W m-1 K-1, λp = 10-2 W m-1 K-1, λp = 10-1 W m-1 K-1, and λp = 1 W m-1 K-1, respectively. The luminosity of the central star is assumed to be equal to the solar luminosity, and J1 = −0.5. |
| In the text | |
|
Fig. 3 Experimental setup for measuring the photophoretic motion of small dust aggregates. a) Sketch of the overall experimental setup. b) Intensity profile of the laser beam used in the experiments. c) Vibrating sieve as an injector of dust aggregates for the experiments with large dust aggregates. Experiments with small dust particles used a cogwheel-type dust injector, as shown in a). |
| In the text | |
|
Fig. 4 Cumulative distributions of particle and aggregate radii for the three different particle materials and the different experiment types performed in the two microgravity drop-tower campaigns. a) Black SiO2 (monomer radii 0.5 μm). b) Olivine (monomer radii 0.5−15 μm). c) Transparent SiO2 particles (monomer radii 0.75 μm). The different symbols and colours indicate the size distributions generated by the cogwheel injection (around 1 μm) and by the vibrating sieve injection with different mesh sizes, respectively (units in μm, see inset). |
| In the text | |
|
Fig. 5 Monomer-particle types used for the photophoresis experiments. a) Monodisperse spherical black SiO2 particles with radii of 0.5 μm (silica spheres coated with a black organic colour, adopted from Steinbach 2004). b) Irregular San-Carlos olivine particles with a radius distribution of 0.5−15 μm. c) Monodisperse spherical transparent SiO2 particles with radii of 0.75 μm. A scale bar of 10 μm length is shown in each sub-figure. |
| In the text | |
|
Fig. 6 Typical trajectories of large dust aggregates. The measured position data and the linear (red) and 2nd order polynomial (blue) fits are shown. In a), the linear fit is better when comparing the goodness of fit by the reduced mean chi square value, in b) the 2nd order polynomial fit is better, as shown by the residuals in the respective bottom graphs. |
| In the text | |
|
Fig. 7 Dependence of the photophoretic velocity for different illumination intensities. a) Intensity dependence of the median of the photophoretic velocity distribution for the indicated size range for black-coloured silica particles (all sizes in μm). The solid black line indicates the slope as expected by theory (arbitrary offset). b) Intensity dependence of the width of the photophoretic velocity distribution for the indicated size range for black-coloured silica particles (all sizes in μm). The solid black line indicates the slope as expected by theory (arbitrary offset). c) Relation between the median velocity and the width of the velocity distribution for the black-colored silica particles. The typical error for the single data points is indicated in figure a). |
| In the text | |
|
Fig. 8 Test for the gas-pressure dependence of the photophoretic velocity. a) Photophoretic velocities of individual black SiO2 dust aggregates for two different gas pressures. The solid line shows a linear fit to the data, which, within the limits of the accuracy of the fit, shows the pressure-independence of the photophoretic velocity. b) The cumulative size distribution of the subset of dust aggregates from a) for the two pressures. |
| In the text | |
|
Fig. 9 Examples of cumulative photophoretic velocity distribution functions for black SiO2 and for different dust-aggregate radii and radiation intensities. a) Monomers at 0.2−0.3 W cm-2. b) Monomers at 1.0−1.1 W cm-2. c) Aggregates of 125−300 μm radius at 0.2−0.4 W cm-2. d) Aggregates of 125−300 μm radius at 1.0−1.1 W cm-2. |
| In the text | |
|
Fig. 10 Examples of cumulative photophoretic velocity distribution functions for olivine and for different dust-aggregate radii and radiation intensities. a) Small aggregates of 1.6 μm ± 0.75 μm radius at 0.8 W cm-2. b) Small aggregates of 1.6 μm ± 0.75 μm radius at 1.0 W cm-2. c) Large aggregates of 70−125 μm radius at 0.6 W cm-2. d) Large aggregates of 70−125 μm radius at 1.0 W cm-2. |
| In the text | |
|
Fig. 11 Examples of cumulative photophoretic velocity distribution functions for white SiO2 and for different dust-aggregate radii and radiation intensities. a) Aggregates of 50−70 μm radius at 1.12 W cm-2. b) Aggregates of 50−70 μm radius at 1.47 W cm-2. c) Aggregates of 70−125 μm radius at 1.12 W cm-2. d) Aggregates of 70−125 μm radius at 1.47 W cm-2. |
| In the text | |
|
Fig. 12 The photophoretic velocities of black SiO2 and olivine dust aggregates as a function the dust-aggregate radius. a) and c) show the results of black SiO2 for the median velocity and the width of the velocity distribution, respectively. b) and d) show the results of olivine for the median velocity and the width of the velocity distribution, respectively. Theoretical curves, following Eq. (4), are shown for an illumination intensity of 1 W cm-2, for a gas pressure of 100 Pa (1000 dyn/cm2), and |λp/J1| = 0.1,1,10 W m-1 K-1. Brownian motion can only contribute to velocities below the blue line. An error estimate for the single data points is indicated in figure a). |
| In the text | |
|
Fig. 13 Normalized velocity distributions for the three dust materials. a) Black SiO2. b) Olivine. c) White SiO2. Dotted curves indicate individual velocity distributions; the red solid curve is the mean of all curves for a given material; for comparison, a Gaussian of the same normalized width is shown as blue solid curves. Below the three panels, the deviation of the mean distribution from the Gaussian is shown. |
| In the text | |
|
Fig. 14 The 2.1%, 15.9%, 50.0%, 84.1% and 97.7% quantiles of the photophoretic velocity distributions for the three dust materials presented in this study. Note that all 2.1% and 15.9% values shown are negative so that we display their absolute value here. Velocities are normalized to an intensity of 1 W cm-2. The theoretical expectations for the photophoretic velocity for the values of λ/J1 = 1.0, 0.1 and 0.01 are indicated by the solid gray lines, the solid blue line indicates the upper boundary of the motion which could be attributed to Brownian motion. |
| In the text | |
|
Fig. 15 Material dependence of the photophoretic effect. a) Size distributions of the sub-samples of black SiO2 (diamonds), olivine (triangles) and white SiO2 (squares) dust aggregates, respectively. b) The corresponding distributions of the intensity-normalized velocities for the three materials. |
| In the text | |
Current usage metrics show cumulative count of Article Views (full-text article views including HTML views, PDF and ePub downloads, according to the available data) and Abstracts Views on Vision4Press platform.
Data correspond to usage on the plateform after 2015. The current usage metrics is available 48-96 hours after online publication and is updated daily on week days.
Initial download of the metrics may take a while.