Fig. 12
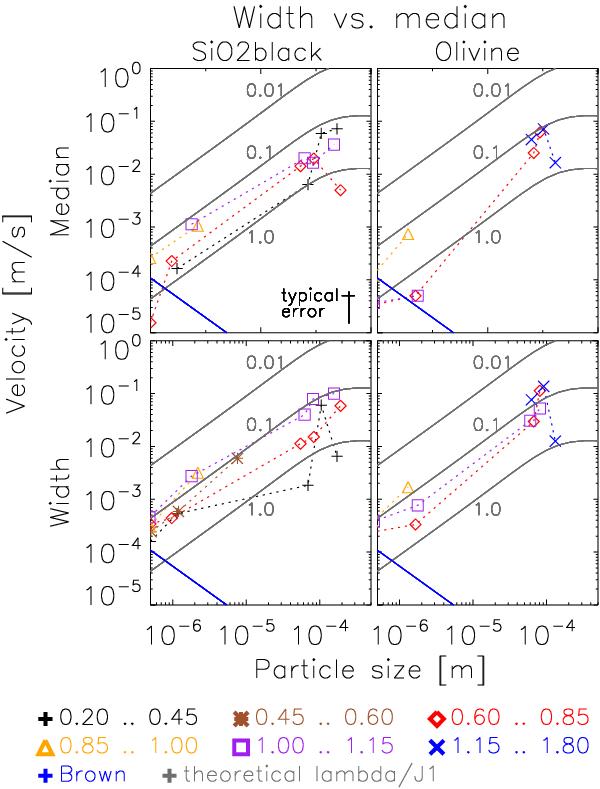
The photophoretic velocities of black SiO2 and olivine dust aggregates as a function the dust-aggregate radius. a) and c) show the results of black SiO2 for the median velocity and the width of the velocity distribution, respectively. b) and d) show the results of olivine for the median velocity and the width of the velocity distribution, respectively. Theoretical curves, following Eq. (4), are shown for an illumination intensity of 1 W cm-2, for a gas pressure of 100 Pa (1000 dyn/cm2), and |λp/J1| = 0.1,1,10 W m-1 K-1. Brownian motion can only contribute to velocities below the blue line. An error estimate for the single data points is indicated in figure a).
Current usage metrics show cumulative count of Article Views (full-text article views including HTML views, PDF and ePub downloads, according to the available data) and Abstracts Views on Vision4Press platform.
Data correspond to usage on the plateform after 2015. The current usage metrics is available 48-96 hours after online publication and is updated daily on week days.
Initial download of the metrics may take a while.