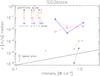
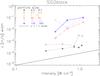
Fig. 7
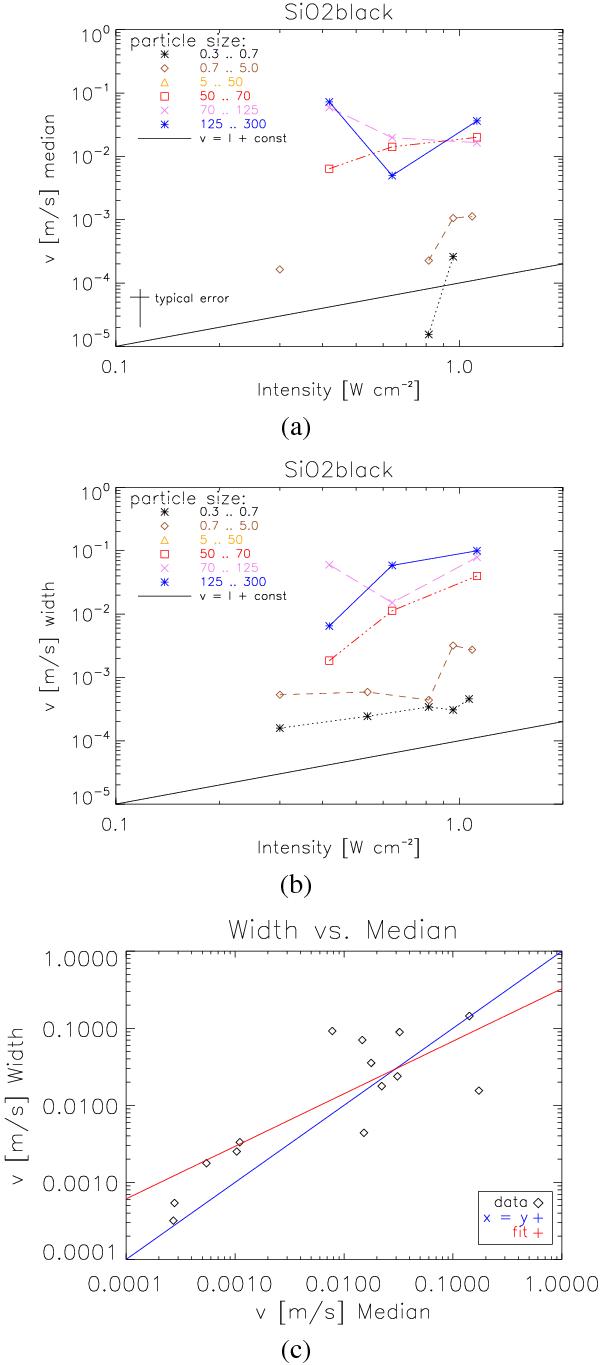
Dependence of the photophoretic velocity for different illumination intensities. a) Intensity dependence of the median of the photophoretic velocity distribution for the indicated size range for black-coloured silica particles (all sizes in μm). The solid black line indicates the slope as expected by theory (arbitrary offset). b) Intensity dependence of the width of the photophoretic velocity distribution for the indicated size range for black-coloured silica particles (all sizes in μm). The solid black line indicates the slope as expected by theory (arbitrary offset). c) Relation between the median velocity and the width of the velocity distribution for the black-colored silica particles. The typical error for the single data points is indicated in figure a).
Current usage metrics show cumulative count of Article Views (full-text article views including HTML views, PDF and ePub downloads, according to the available data) and Abstracts Views on Vision4Press platform.
Data correspond to usage on the plateform after 2015. The current usage metrics is available 48-96 hours after online publication and is updated daily on week days.
Initial download of the metrics may take a while.