Fig. 8
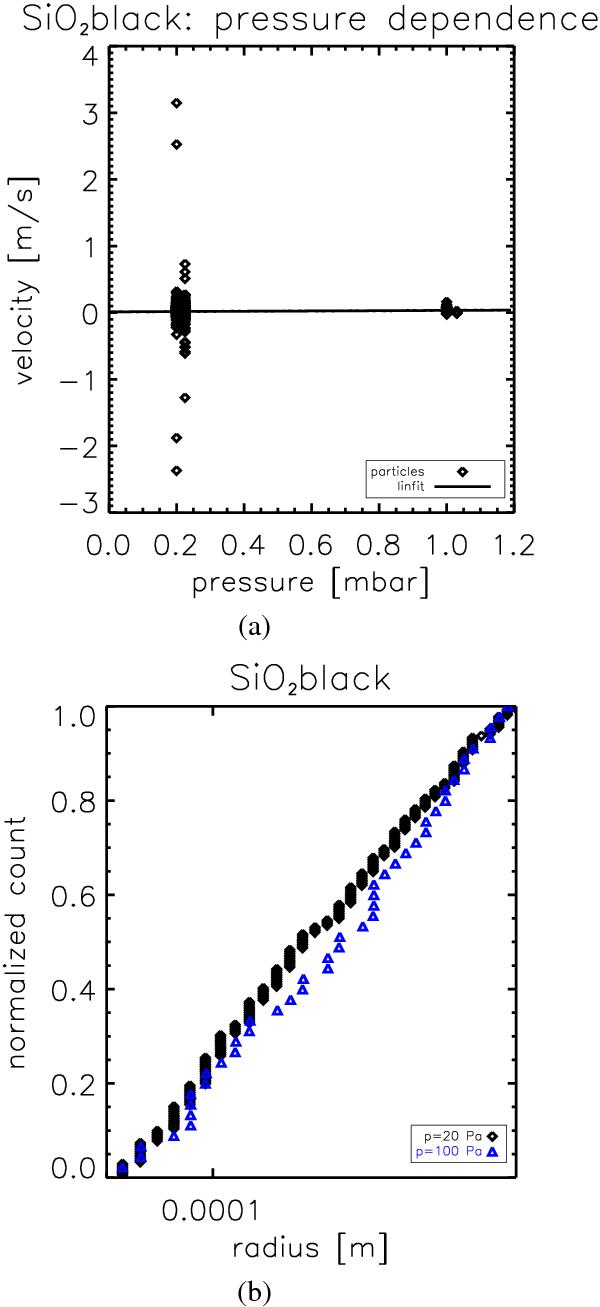
Test for the gas-pressure dependence of the photophoretic velocity. a) Photophoretic velocities of individual black SiO2 dust aggregates for two different gas pressures. The solid line shows a linear fit to the data, which, within the limits of the accuracy of the fit, shows the pressure-independence of the photophoretic velocity. b) The cumulative size distribution of the subset of dust aggregates from a) for the two pressures.
Current usage metrics show cumulative count of Article Views (full-text article views including HTML views, PDF and ePub downloads, according to the available data) and Abstracts Views on Vision4Press platform.
Data correspond to usage on the plateform after 2015. The current usage metrics is available 48-96 hours after online publication and is updated daily on week days.
Initial download of the metrics may take a while.