Fig. 6
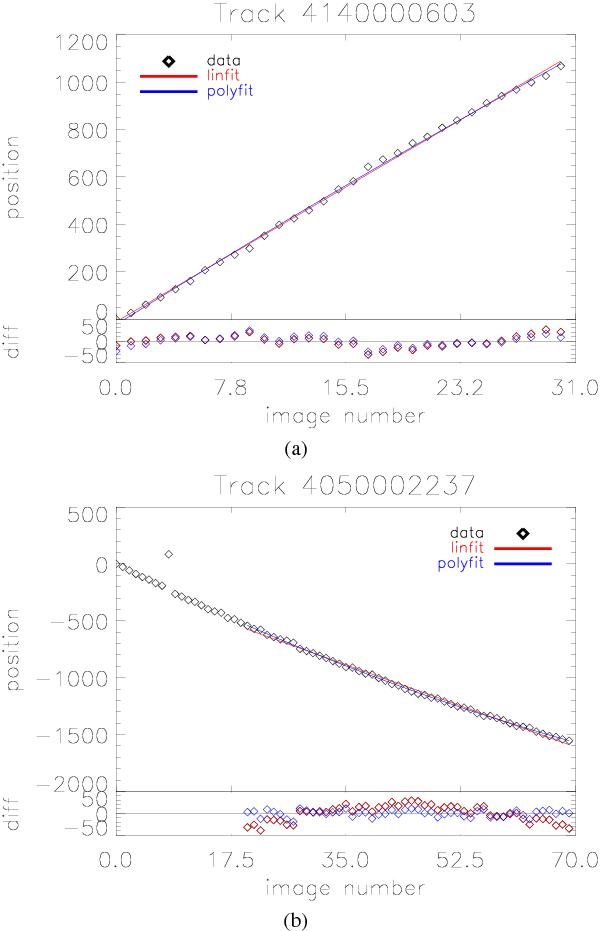
Typical trajectories of large dust aggregates. The measured position data and the linear (red) and 2nd order polynomial (blue) fits are shown. In a), the linear fit is better when comparing the goodness of fit by the reduced mean chi square value, in b) the 2nd order polynomial fit is better, as shown by the residuals in the respective bottom graphs.
Current usage metrics show cumulative count of Article Views (full-text article views including HTML views, PDF and ePub downloads, according to the available data) and Abstracts Views on Vision4Press platform.
Data correspond to usage on the plateform after 2015. The current usage metrics is available 48-96 hours after online publication and is updated daily on week days.
Initial download of the metrics may take a while.