Fig. 13
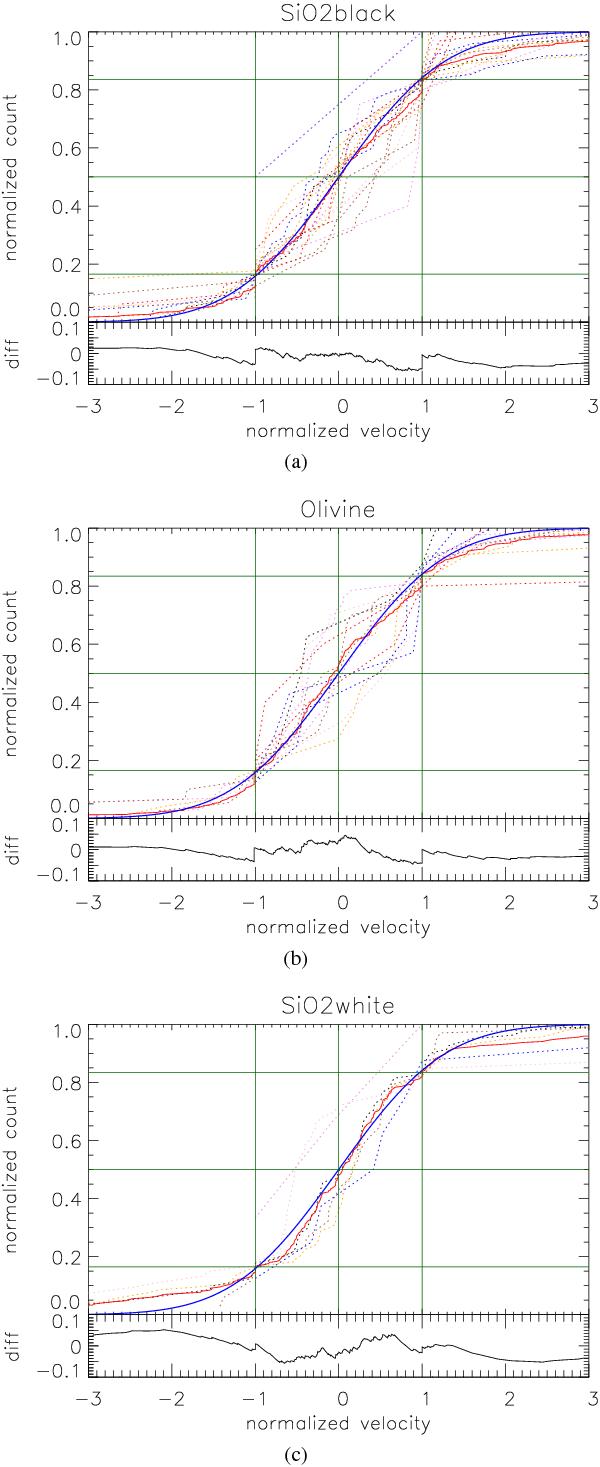
Normalized velocity distributions for the three dust materials. a) Black SiO2. b) Olivine. c) White SiO2. Dotted curves indicate individual velocity distributions; the red solid curve is the mean of all curves for a given material; for comparison, a Gaussian of the same normalized width is shown as blue solid curves. Below the three panels, the deviation of the mean distribution from the Gaussian is shown.
Current usage metrics show cumulative count of Article Views (full-text article views including HTML views, PDF and ePub downloads, according to the available data) and Abstracts Views on Vision4Press platform.
Data correspond to usage on the plateform after 2015. The current usage metrics is available 48-96 hours after online publication and is updated daily on week days.
Initial download of the metrics may take a while.