| Issue |
A&A
Volume 547, November 2012
|
|
|---|---|---|
| Article Number | A44 | |
| Number of page(s) | 13 | |
| Section | Cosmology (including clusters of galaxies) | |
| DOI | https://doi.org/10.1051/0004-6361/201219508 | |
| Published online | 24 October 2012 | |
Structure of Abell 1995 from optical and X-ray data: a galaxy cluster with an elongated radio halo⋆
1
Fundación Galileo Galilei – INAF (Telescopio Nazionale Galileo), Rambla
José Ana Fernández Perez 7, 38712 Breña Baja (La Palma)
Canary Islands
Spain
e-mail: This email address is being protected from spambots. You need JavaScript enabled to view it.
2
Dipartimento di Fisica dell’Università degli Studi di Trieste –
Sezione di Astronomia, via Tiepolo
11, 34143
Trieste,
Italy
3
INAF – Osservatorio Astronomico di Trieste, via Tiepolo
11, 34143
Trieste,
Italy
4
Instituto de Astrofísica de Canarias, C/vía Láctea s/n, 38205 La Laguna (Tenerife),
Canary Islands,
Spain
5
Departamento de Astrofísica, Universidad de La
Laguna, Av. del Astrofísico
Francisco Sánchez s/n, 38205 La Laguna (Tenerife), Canary Islands,
Spain
Received: 30 April 2012
Accepted: 27 September 2012
Abstract
Context. Abell 1995 is a puzzling galaxy cluster hosting a powerful radio halo, but it has not yet been recognized as a obvious cluster merger, as usually expected for clusters with diffuse radio emission.
Aims. We aim at an exhaustive analysis of the internal structure of Abell 1995 to verify that this cluster is really dynamically relaxed, as reported in previous studies.
Methods. We base our analysis on new and archival spectroscopic and photometric data for 126 galaxies in the field of Abell 1995. The study of the hot intracluster medium was performed on X-ray archival data.
Results. Based on 87 fiducial cluster members, we have computed the average cluster redshift ⟨z⟩ = 0.322 and the global radial velocity dispersion σV ~ 1300 km s-1. We detect two main optical subclusters separated by 1.5′that cause the known NE-SW elongation of the galaxy distribution and a significant velocity gradient in the same direction. As for the X-ray analysis, we confirm that the intracluster medium is mildly elongated, but we also detect three X-ray peaks. Two X-ray peaks are offset with respect to the two galaxy peaks and lie between them, thus suggesting a bimodal merger caught in a phase of post core-core passage. The third X-ray peak lies between the NE galaxy peak and a third, minor galaxy peak suggesting a more complex merger. The difficulty of separating the two main systems leads to a large uncertainty on the line-of-sight (LOS) velocity separation and the system mass: ΔVrf,LOS = 600–2000 km s-1and Msys = 2–5×10¹⁵ h70-1 M⊙, respectively. Simple analytical arguments suggest a merging scenario for Abell 1995, where two main subsystems are seen just after the collision with an intermediate projection angle.
Conclusions. The high mass of Abell 1995 and the evidence of merging suggest it is not atypical among clusters with known radio halos. Interestingly, our findings reinforce the previous evidence for the peculiar dichotomy between the dark matter and galaxy distributions observed in this cluster.
Key words: galaxies: clusters: individual: Abell 1995 / galaxies: clusters: general / galaxies: kinematics and dynamics / X-rays: galaxies: clusters
Table 1 is available in electronic form at http://www.aanda.org
© ESO, 2012
1. Introduction
In the past decades, multiwavelength observations from ground and from space have dramatically shown the complexity of the physical phenomena occurring in galaxy clusters. An intriguing aspect of these observations is the discovery of a growing number of clusters exhibiting diffuse radio emission (on Mpc scale), i.e. large-scale areas of radio emission without any obvious galaxy counterpart (Giovannini & Feretti 2002; Ferrari et al. 2008; Venturi 2011). Particularly prominent are the radio features known as radio halos, which usually pervade the central cluster regions in a similar way to the intracluster medium (ICM). Instead, radio emission areas found at the edges of clusters are known as radio relics.
The cause of radio halos and relics is still under investigation. They are likely to result from synchrotron nonthermal radiation originating from relativistic electrons of the ICM moving in large-scale cluster magnetic fields. From a theoretical point of view, cluster mergers have been proposed as the key process for shedding light on the origin of these diffuse radio sources. In fact, the huge energy of these events could reaccelerate mildly relativistic electrons to relativistic energies and amplify the cluster magnetic fields (e.g., Feretti 1999). In particular, radio relics seem to be connected with large-scale shock waves occurring during mergers (e.g., Ensslin et al. 1998; Hoeft et al. 2004). Instead, radio halos are probably related to the turbulent motions of the ICM following a merger (e.g., Cassano et al. 2006; Brunetti et al. 2009), but the precise scenario is still being debated.
X-ray observations have been crucial to deriving the dynamical state of clusters hosting diffuse radio emission. Several statistical studies (see, e.g., Buote 2002; Cassano et al. 2010; Rossetti et al. 2011) have discovered interesting correlations between the properties of radio halos and relics and the ICM X-ray luminosity and temperature (Giovannini & Feretti 2002, and references therein). This is also true when comparing point-to-point the X-ray and radio surface brightnesses (Govoni et al. 2001). Nevertheless, in a pilot study using the Sunyaev-Zel’dovich effect, Basu (2012) finds the lack of bimodality in the radio power – integrated SZ effect measurement diagram, the contrary of what is found in the radio power – X-ray luminosity diagram (Brunetti et al. 2007). This study shows the need to adopt more investigation techniques in addition to the X-ray data analysis.
Optical observations can be very helpful when checking for mergers in clusters with diffuse radio emission and studying their internal dynamics, too (e.g., Girardi & Biviano 2002). In particular, combined X-ray/optical studies can be very effective at revealing and quantifying the level of substructure, when checking for premerging subsystems and/or merger remnants. The power of this approach comes from the fact that mergers affect the ICM and the galaxy distributions in different ways, as shown by numerical simulations (e.g., Roettiger et al. 1997). Thus, X-ray and optical observations complement each other to provide a more complete picture of merger events.
It is with this scientific rationale in mind that we have begun a long-term optical observational program to investigate the properties of clusters hosting radio halos and/or relics: the “dynamical analysis of radio clusters” (DARC) program (see Girardi et al. 2010a). Among the dozens of clusters with known diffuse radio sources, we decided to perform an optical and X-ray investigation of the interesting cluster Abell 1995 (hereafter A1995).
In the X-ray band, A1995 appears as a luminous and hot cluster: LX(0.1–2.4 keV) =  erg s-1 (Böhringer et al. 2000); kTX = 7−9 keV (from Chandra data, see e.g. Baldi et al. 2007; Bonamente et al. 2008; Ehlert & Ulmert 2009).
At optical wavelengths, A1995 is a rich cluster (Abell richness class = 1; Abell et al. 1989). Its light distribution is quite elongated in the NE-SW direction, but the mass shows a more circular distribution and is more concentrated than galaxies, as shown by the weak gravitational lensing reconstruction by Dahle et al. (2002). Holhjem et al. (2009) confirm this interesting discrepancy between light and mass distribution (see discussion in Sect. 5).
As for previous redshift data, Patel et al. (2000) obtained spectra for 15 member galaxies and estimate a cluster redshift of z = 0.322 ± 0.001 and a radial velocity dispersion  km s-1. Irgens et al. (2002) confirm these measurements on the basis of 20 (unpublished) redshifts, six of them in common with those of Patel et al. (2000), with z = 0.3207 ± 0.0001 and
  km s-1. Moreover, they find good agreement between the galaxy velocity dispersion and the dark matter velocity dispersion obtained from the weak gravitational lensing analysis (σDM = 1240 ± 80 km s-1).
The X-ray ROSAT-HRI emission is peaked on a central bright galaxy and shows modest elongation in the NE-SW direction, which is not clearly separated from the emission of two very bright pointlike sources (see Fig. 1 of Patel et al. 2000; see also Ota & Mitsuda 2004). Ota & Mitsuda (2004) classify A1995 as a regular cluster from the stability of the X-ray centroid position and the good fit with a single β-model profile. However, despite its regular appearance, A1995 has a very large cooling time (tcool = 10.7 Gyr; see Fig. 12 of Ota & Mitsuda 2004) and thus no evidence of a cool core.
Summarizing previous results, there is some hint but no clear evidence of substructure in A1995, and indeed, on the basis of optical and X-ray appearance, Pedersen & Dahle (2007) include this cluster in the sample of relaxed systems.
About the radio wavelengths, Owen et al. (1999) first reported a possible detection of a diffuse radio source in A1995. Giovannini et al. (2009) analyzed new VLA data and discovered an evident radio halo in this cluster, with a size of ~0.8  Mpc and radio power of
  W Hz-1. The radio halo appears somewhat elongated in the NE-SW direction (Giovannini et al. 2009; see also Fig. 1).
In the context of our DARC program, we proposed new spectroscopic observations of A1995 with the Telescopio Nazionale Galileo (TNG). We also performed new photometric observations at the Isaac Newton Telescope (INT) and used archival data of the Sloan Digital Sky Survey (SDSS). As for the analysis in the X-ray band, we used archival data downloaded from the Chandra Archive.
In this paper, Sect. 2 presents the new spectroscopic and photometric data. Section 3 describes the analysis of the optical data, while Sect. 4 presents the analysis of the Chandra archival data. Finally, in Sect. 5, we discuss our results and propose a scenario for the dynamical status of A1995.
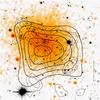 |
Fig. 1 Optical/X-ray/radio view of A1995 (direct sky view with north up). A smoothed Chandra 0.3−7 keV image (orange and yellow colors) of A1995 is superimposed on an RH-band image taken with the INT. Thin contours are the radio contour levels from Giovannini et al. (2009; VLA data at 1.4 GHz with discrete sources subtracted, courtesy of Govoni). Thick contours are the mass distribution contours from Holhjem et al. (2009). Numbers highlight notable galaxies mentioned in the text. |
Throughout this paper, we adopt a flat cosmology with H0 = 70 km s-1 Mpc-1 (h70 = H0/70 km s-1 Mpc-1), Ω0 = 0.3 and ΩΛ = 0.7. With this choice of the cosmological parameters, the scale is ~280 kpc/arcmin at the redshift of A1995. Errors are given at the 68% confidence level (hereafter c.l.), unless otherwise stated.
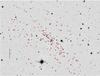 |
Fig. 2 Field of the cluster A1995 (direct sky view with north up) observed with the INT in the RH-band. Cluster members are indicated by circles, while nonmember galaxies are shown by squares (see Table 1). Numbers highlight the IDs of notable galaxies as in Fig. 1. |
2. Galaxy data and catalog
2.1. Spectroscopic observations
We performed spectroscopic observations of A1995 in May 2009. As usual for the clusters in our DARC sample, we used the instrument DOLORES at TNG1 in MOS mode with the LR-B grism, which covers the wavelength range 3000–8430 Å. In summary, we obtained 143 spectra from four observed masks. For each mask, the total exposure time was 5400 s.
Reduction of spectra and radial velocities computation with the cross-correlation technique (CC; Tonry & Davis 1979) were performed using standard IRAF2 tasks, as for other clusters included in our DARC sample (for a detailed description see, e.g., Boschin et al. 2012, hereafter B12). In eight cases (IDs. 02, 03, 08, 14, 16, 29, 52, and 91; see Table 1) the redshift was estimated with the EMSAO package (based on the wavelength location of emission lines in the spectra). Our spectroscopic catalog lists a total of 126 galaxies.
After comparing the velocity measurements for galaxies observed with multiple masks (see discussion in, e.g., Boschin et al. 2004; Girardi et al. 2011), we corrected the velocity errors provided by the CC technique by multiplying them for a factor ~2. After taking the above correction into account, the median value of the cz errors is 74 km s-1.
We also compared our data with those of Patel et al. (2000), finding 13 out of 15 galaxies in common. The two redshift measurements agree with a one-to-one relation, but the χ2 of the fit reaches a reasonable value only by multiplying their errors by at least a factor 1.5. This leads to their typical errors being three times larger than our typical errors. Considering these large errors, we preferred not to add this additional information and to study our (homogeneous) sample.
2.2. Photometric observations
We performed photometric observations of A1995 in January 2008 by using the Wide Field Camera (WFC3) mounted on the 2.5 m INT Telescope. The sky conditions were photometric and the seeing was ~1.4 . In particular, we observed with the Harris BH (15 exposures of 600 s) and RH (18 exposures of 300 s) filters. This means a total exposure time of 9000 s and 5400 s in each band.
We reduced the data and produced our photometric galaxy catalog by using standard procedures (see, e.g., B12 for details on the reduction of the WFC images). After transformation of BH and RH magnitudes into the B and R Johnson-Cousins magnitudes (Johnson & Morgan 1953; Cousins 1976) and magnitude correction for the galactic extinction (with AB ~ 0.06 and AR ~ 0.04, respectively; Schlegel et al. 1998), we estimated that the completeness of the photometric sample is 90% for R ≤ 21.2 and B ≤ 22.7.
2.3. Galaxy catalog and notable galaxies
Table 1 collects all the spectroscopic and photometric information for the 126 galaxies with a measured redshift (see also Fig. 2): ID and IDm (Cols. 1 and 2) are the identification number of each galaxy and member galaxies, respectively; Col. 3 reports the equatorial coordinates, α and δ (J2000); Cols. 4 and 5 list the B and R magnitudes; Col. 6 lists the radial (heliocentrically corrected) velocites, v = cz⊙, with their errors, Δv (Col. 7).
A1995 hosts a dominant galaxy (ID. 61, R = 17.78, hereafter BCG) ~0.8 mag brighter than the second brightest member galaxy (ID. 76). The X-ray ROSAT-HRI emission peaks on the BCG (e.g., Patel et al. 2000).
There are several X-ray and radio emitting galaxies in the field of A1995. Among them, our ID. 89 (a background galaxy) is an evident pointlike source in Chandra archival data (see Fig. 1). Cooray et al. (1998) highlight two bright radio pointlike sources in A1995: 1453+5803 and 1452+5801. Taking a look at the radio map provided by Giovannini et al. (2009, see their Fig. 8, right panel), we identify 1453+5803 with our ID. 71, which is a cluster member. Instead, 1452+5801 is likely a background source.
3. Analysis of the optical data
3.1. Member selection
As for other DARC clusters, we selected cluster members by running two statistical tests. First, we used the 1D-DEDICA method (Pisani 1993, 1996) on the 126 galaxies with redshifts. The method detects A1995 as a significant peak (at >99% c.l.) in the velocity distribution located at z ~ 0.322. The peak includes 94 (provisional) member galaxies (see Fig. 3).
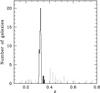 |
Fig. 3 Histogram of 126 galaxy redshifts. The 94 (provisional) cluster members are highlighted with the solid line (see text). |
Then, we used a second tool for member selection, which uses both the spatial and velocity information: the “shifting gapper” method (Fadda et al. 1996; see also, e.g., Girardi et al. 2011, for details on the application of this technique). Here, we only point out that the method needs the definition of a cluster center. For A1995, we chose the location of the BCG (see Table 1). The application of the “shifting gapper” rejected another seven galaxies in the outskirts of the cluster (Fig. 4 – top panel). Finally we obtained a sample of 87 fiducial cluster members (Fig. 5).
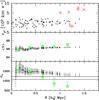 |
Fig. 4 The 94 (provisional) cluster members (see also Fig. 3) in the phase space (see top panel). The ordinate is the rest-frame velocity, the abscissa the projected clustercentric distance. Galaxies rejected by the “shifting gapper” procedure are shown with (red) crosses. For the cluster center we adopt the location of the BCG (see text). Big green circles and small points show the differential and integral profiles of the mean velocity (in the middle panel) and the radial velocity dispersion (in the bottom panel). In the bottom panel, two horizontal lines mark the range of possible values for the ICM temperature (7−9 keV) with their respective errors transformed to σV (see Sect. 5 for details). |
3.2. Global cluster properties
The first and second moments of a distribution can be efficiently computed by using the biweight estimators of location and scale (Beers et al. 1990). Their application to the velocity distribution of our 87 cluster members provided a measurement of the mean cluster redshift and of the global radial velocity dispersion, where we found ⟨z⟩ = 0.3217 ± 0.0005 (i.e. ⟨v⟩ = 96 437 ± 140 km s-1) and  km s-1, respectively.
Analysis of the velocity dispersion profile (Fig. 4) suggests that the value computed for σV is quite robust. In fact, the integral profile is asymptotically flat within the errors. Instead, the decrease in the differential profile agrees with the fact that the cluster is free of interlopers, as also seen in the velocity vs. clustercentric distance diagram (Fig. 4 – top panel). As for the mean velocity profile, the modestly higher values of the mean velocity in the external region (Fig. 4 – middle panel) probably come from the slightly larger sampling in the NE external regions, where galaxies have higher velocities (see Sect. 3.5).
3.3. Analysis of the velocity distribution
Deviations of the velocity distribution from Gaussianity can provide signs of disturbed dynamics. This can be checked by applying classical shape estimators (Bird & Beers 1993). We did not not find significant evidence of departures from Gaussianity by using the skewness, the kurtosis, and the STI estimators.
We also searched for significant gaps in the velocity distribution. In particular, we performed the weighted gap analysis (Beers et al. 1991, 1992). We detected one significant gap that divides the cluster into two groups (see Fig. 5): GV1 (with 42 galaxies and lower velocities) and GV2 (with 45 galaxies and higher velocities). The BCG resides in the GV1 group, but it lies on the border with GV2.
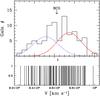 |
Fig. 5 The 87 galaxies recognized as cluster members. Top panel: radial velocity distribution with the arrow indicating the velocity of the BCG. Red and blue Gaussians are the best two-group partition fits according to the 1D-KMM test (see text). Bottom panel: stripe density plot. The position of the significant gap is marked by an arrow. |
Kinematical properties of several subsystems.
When considering the spatial distributions of the galaxies of GV1 and GV2, we found that they are different at the 99.94% c.l. according to the 2D KS-test (Fasano 1987, see our Fig. 6). A statistical test useful to search for eventual subsets in the velocity distribution is the 1D-Kaye’s mixture model test (1D-KMM; Ashman et al. 1994; see also, e.g., B12 for a description of the method).
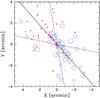 |
Fig. 6 2D distribution of 87 cluster members. Galaxies with smaller (larger) symbols have higher (lower) radial velocities. Blue circles and red crosses identify galaxies of GV1 and GV2. The origin of the coordinates is the location of the BCG. The solid and dashed lines indicate the position angle of the cluster velocity gradient (see text) and relative errors, respectively. |
We applied this technique by assessing whether a two-Gaussian partition (accordingly to the detection of the two groups GV1 and GV2) can provide a significantly better fit to the velocity distribution than a sole Gaussian. The result of the 1D-KMM test is negative. However, the best-fit result of the 1D-KMM method gives two groups (KMM1D-1 and KMM1D-2) of 40 and 47 galaxies, very similar to the groups GV1 and GV2 (but note that the BCG is now belonging to KMM1D-2, the high-velocity group). The spatial distributions of the galaxies of KMM1D-1 and KMM1D-2 are different, too (at the 99.75% c.l.). In Fig. 5 and Table 2 we present the results for the two Gaussians with the velocity dispersions computed by the 1D-KMM procedure, which considers the membership probabilities of the galaxies to belong to a group, rather than the velocity dispersions computed on the galaxy group populations after the assignment. In this way we could bypass the artificial truncation of the velocity distribution tails of KMM1D-1 and KMM1D-2, thus minimizing the danger of heavily underestimating the velocity dispersions of the two subclusters.
3.4. Analysis of the galaxy spatial distribution
We applied the 2D-DEDICA method to the sky positions of A1995 member galaxies to search for eventual subsets in the galaxy spatial distribution. We found a NE-SW elongated structure with two significant peaks, one of them (the NE one) centered on the BCG (Fig. 7). However, this finding could be affected by the magnitude incompleteness of our spectroscopic sample. To test the robustness of the 2D-DEDICA results, we resorted to the photometric catalogs.
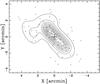 |
Fig. 7 Isodensity contours of the cluster members spatial distribution computed with 2D-DEDICA. The origin of the coordinates is the location of the BCG (the big cross). Small circles mark the positions of cluster members relative to the BCG. |
We used the color–magnitude relation (CMR) of early-type galaxies (the dominant galaxy population in the densest, internal cluster regions; e.g. Dressler 1980) to select likely cluster members from our photometric sample (see B12 for details on the technique used for the determination of the CMR and the selection of member galaxies). We found B − R = 4.164−0.081 × R (see Fig. 8). Figure 9 illustrates the contour map for the likely cluster members (513 with R < 21 in the whole INT field): we confirm that A1995 is described well by an elongated structure. The two most significant peaks have similar densities, one centered on the BCG galaxy and one ~1.5′ at SW.
Table 3 lists information for these two main peaks (2D-NE and 2D-SW clumps), including NS, the number of members (Col. 2), the peak densities, ρS, relative to the densest peak (Col. 4), and the significance of the peaks estimated through the value of χ2 (Col. 5). We also detect a minor peak (2D-NENE in Table 3, the third in galaxy density) whose statistical significance, although nominally acceptable, is much lower than the two main peaks.
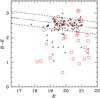 |
Fig. 8 B − R vs. R diagram for the 126 galaxies with spectroscopic information. Small black squares are cluster members, while big red squares represent field galaxies. The solid line shows the best-fit CMR as computed from cluster members; the dashed lines mark the region where likely cluster members were selected from the photometric catalogs. |
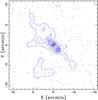 |
Fig. 9 Results of the 2D-DEDICA method (blue isodensity contour lines) applied to likely A1995 members (see text) with R < 21. The origin of the coordinates is the location of the BCG (the big cross). Small circles mark the positions of likely cluster members relative to the BCG. |
We also considered the SDSS photometric catalogs (already corrected for Galactic absorption). In this case, we selected likely member galaxies by considering the CMRs in the (r′–i′ vs. r′) and (g′–r′ vs. r′) color-r′ mag diagrams (see Goto et al. 2002, and B12). The two CMRs are r′–i′= 1.009−0.022 × r′ and g′− r′= 2.878−0.062 × r′, respectively. The result for r′< 21.5 (the limit for the SDSS star/galaxy classification) confirms the results reported above.
3.5. 3D analysis: combining spatial and velocity information
The 3D tests searching for correlations between positions and velocities of member galaxies are powerful tools for revealing real substructures in clusters. First, we checked for a velocity gradient in the set of the 87 fiducial cluster members (see, e.g., den Hartog & Katgert 1996; Girardi et al. 1996). We found a significant (at the 96% c.l.) velocity gradient with  degrees (counter-clock-wise from north). This means that the NE region of the cluster is populated by higher velocity galaxies (see Fig. 6).
Substructure from analysis of the INT photometric sample.
A classical test to detect the presence of substructures is the Δ-statistics (Dressler & Schectman 1988, hereafter DS-test). We applied this test by defining, for each galaxy, the δ parameter (determined considering the Nnn = 10 neighbors of each galaxy; see, e.g., B12 for a description of the method) and computing the departure Δ of the local kinematic quantities from the global parameters. We also applied the ϵ-test (Bird 1993) and the α-test (West & Bothun 1990; see also, e.g., Pinkney et al. 1996; and Ferrari et al. 2003, for details of these 3D tests). Both the DS-test and the α-test detected the presence of substructures (at the 98.5% and 95% c.l., respectively).
A better interpretation of the results of the DS-test can be reached by splitting the contributions of the local mean velocity (estimator δV) and dispersion (estimator δs) to the classical δ parameter (see B12 for details; see also Girardi et al. 1997, 2010b). Moreover, we investigated the results of the DS-test obtained by changing the number of neighbors.
The two panels of Fig. 10 illustrate the significant results for the two kinematical indicators. This figure shows the spatial distribution of the 87 cluster members. Each galaxy is indicated by a bubble, where the size of the bubble is related to the value of δ, the deviation of the local kinematic estimator from the global cluster value. As for the δV estimator, the substructure significance increases up to >99.9% c.l. when Nnn = 40. Figure 10 (upper panel) shows that there are two regions of different local mean velocities at NE and SW, in agreement with the velocity gradient discussed above, and likely corresponding to a low- and a high-velocity galaxy populations. When considering the δs estimator, the substructure significance is higher at smaller Nnn. Figure 10 (lower panel) shows a NE region of low local velocity dispersions (Nnn = 10, significance at the 96% c.l.). Probably, in that region, there is a minor mixing of the low- and high-velocity populations.
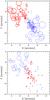 |
Fig. 10 Positions on the plane of the sky of 87 cluster members (marked by bubbles). Top panel: DS-test bubble plot for the deviation δV,i and Nnn = 40 (see text for an explanation). Bottom panel: as above, but for the deviation δs,i and Nnn = 10. In both panels, thin/blue (thick/red) bubbles show regions with a local value lower (higher) than the global one. |
We also applied the full 3D-KMM method. Considering GV1 and GV2 as a guess for an initial two-group partition, we find that the 3D galaxy distribution is well described by a partition of 49 and 38 galaxies (KMM3D-1 and KMM3D-2 groups). The improvement over the sole 3D Gaussian is significant at the 98% c.l. Figure 11 illustrates the distribution of KMM3D-1 and KMM3D-2 on the plane of the sky and the two Gaussians in the velocity distribution. Table 2 lists the main properties of these two groups. With this 3D test, the values of the velocity dispersions of KMM3D-1 and KMM3D-2 are much higher than those of the corresponding groups obtained with the 1D methods previously described.
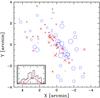 |
Fig. 11 2D distribution of 87 cluster members. Galaxies with smaller (larger) symbols have higher (lower) radial velocities. Big blue circles and red crosses indicate galaxies of KMM3D-1 and KMM3D-2. The insert plot shows the same velocity distribution of Fig. 5 and the two Gaussians corresponding to the mean velocity and velocity dispersions of KMM3D-1 and KMM3D-2 (blue thin line and red thick line, respectively). |
We finally applied the Htree method (Serna & Gerbal 1996). This method performs a hierarchical clustering analysis and returns the relationship between cluster members based on their relative binding energies (see also, e.g., B12 and Girardi et al. 2011). Figure 12 illustrates the results of the Htree method. In this dendogram the binding energy is reported in abscissa (in arbitrary units) and galaxy pairs and subgroups lie to the left (at lower energy levels). Going down from the top of the dendogram, we note the secondary system HT2 and the main system HT1. HT2 is a group at high velocity. HT1 is the main system and shows a low-velocity substructure (HT12), while its core (HT11) is dominated by the BCG. The spatial distributions of galaxies of HT1, HT2, and HT12 are plotted in Fig. 13. When using the results of the Htree method as seeds for the 3D-KMM method, we do not find any two or three-group partition significantly better than the sole 3D-Gaussian.
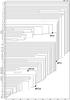 |
Fig. 12 Results obtained with the Htree method (see text). In this dendogram, the horizontal axis reports the binding energy while the vertical axis shows the IDms of the member galaxies (as in Table 1). |
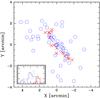 |
Fig. 13 2D distribution of 87 cluster members. Big blue circles and red crosses indicate galaxies of HT1 (main system) and HT2 (high-velocity subcluster). The insert plot shows the same velocity distribution of Fig. 5 (dashed line) and that of HT1 (blue thin line) and HT2 (red thick line). The subcluster HT12 of HT1 is indicated by small blue crosses in the main plot and this causes the low-velocity tail in the insert plot. |
4. X-ray morphological analysis
We studied the morphological properties of the ICM by using archival X-ray data taken with Chandra ACIS-S (exposure ID #906, total exposure time 58 ks). We reduced the data using the package CIAO4 (ver. 4.2) on the chip S3 in a standard way (see, e.g., Boschin et al. 2004).
The reduced image (see Fig. 14) reveals that the ICM exhibits a regular morphology. From a quantitative point of view, this result is supported by the power-ratio (Buote & Tsai 1996) analysis performed by Hart (2008). Moreover, we used the task CIAO/Wavdetect on chip S3 to perform a wavelet multiscale analysis and found no evidence of multiple clumps in the ICM.
We also used the CIAO package Sherpa to fit an elliptical β-model profile (e.g. Boschin et al. 2004) to the X-ray photon distribution (after removing of the pointlike sources found with CIAO/Wavdetect). The best-fit model is characterized by a centroid position located ~4″ east of the BCG and a core radius r0 = 47.3 ± 1.2 arcsec (221 ± 6 kpc). The best-fit values for other parameters are: ϵ = 0.213 ± 0.007 (ellipticity), α = 1.74 ± 0.04 (power law index), and θ = 149.8 ± 1.1 degrees (angle of ellipticity).
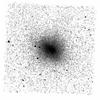 |
Fig. 14 Chandra image of A1995 (smoothed X-ray emission in the energy band 0.3–7 keV, direct sky view with north up). The field of view is 8.5′ × 8.5′. |
The reduced CSTAT statistic (Cash 1979) of the fit is 1.22. Thus, the elliptical beta model is an adequate description to the data. However, we checked for possible deviations in the X-ray photon distribution from the above model by computing the model residuals. We find a deficiency of photons in a dumbbell-shaped region extending along the SSE-NNW direction in proximity of the X-ray centroid position (see Fig. 15). Regions with positive residuals elongated in the NE-SW direction are also found all around the cluster center.
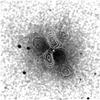 |
Fig. 15 The smoothed X-ray emission of A1995 (direct sky view with north up). Black (white) contours show the positive (negative) elliptical β-mode residuals. Big crosses indicate the two main optical clumps detected with the 2D-DEDICA method (2D-NE and 2D-SW in Table 3). Small cross indicates the third densest peak we detect (2D-NENE). |
5. Discussion and conclusions
Our estimate of the velocity dispersion ( km s-1) agrees with those of Patel et al. (2000) and Irgens et al. (2002) computed on a much smaller galaxy sample. This high value of σV predicts  keV (assuming energy equipartition between galaxies and gas energy per unit mass), and thus agrees with the high measured X-ray temperature kTX = 7−9 keV (from Chandra data, see Baldi et al. 2007; Bonamente et al. 2008; Ehlert & Ulmert 2009). Both σV and TX suggest that A1995 is a massive galaxy cluster.
In the hypothesis of dynamical equilibrium (but see in the following) and typical assumptions (cluster sphericity, galaxies and mass following identical distributions), we computed virial global quantities. By considering Girardi & Mezzetti (2001; see also B12 for details), we obtained a measurement of the mass within the virial radius Rvir: 
 .
.
5.1. Cluster structure and mass
Substructure is detected using several analyses of the cluster galaxy population. Our optical analyses indicate the presence of two main subclusters aligned in the NE-SW direction causing the velocity gradient towards the NE direction and separated by ~1.5′, i.e. a projected linear distance D ~ 0.4 Mpc.
The two subclusters, as determined through 1D- or 3D-KMM methods, have comparable velocity dispersions within the errors, and in both cases they are likely two massive systems. The strong uncertainty in the subcluster membership reflects on the recomputation of the system mass by summing the masses of the two subclumps; i.e., Msys ~ 2−5, where the low (high) value is computed for the 1D (3D) case with a rest-frame velocity separation of ΔVrf,LOS ~ 2000 km s-1(~600 km s-1; see Table 2). Both 1D and 3D methods have their drawbacks. As for the 1D case, the two peaks are not clearly separated in the velocity distribution. In the 3D case, our spectroscopic sample is not spatially complete and less extended than the supposed R200. We thus suggest that intermediate values are closer to the real one. This leads to a mass value not far from the virial mass previously computed considering the global velocity dispersion.
Moreover, we also have indications of a more complex structure: the 2D-DEDICA analysis detects a third, minor central galaxy peak aligned along the NE-SW direction. Finally, the Htree method does not detect a clear bimodal structure.
For the X-ray data analysis, we reaffirm the existence of an isophotes elongation. More quantitatively, we find isophotes are elongated with a position angle PA = θ−90° = 59.8° (where PA is measured in a clockwise direction from the north; see Sect. 4). This PA agrees with the direction of the velocity gradient and is slightly larger than the PA suggested by the direction defined by the two main optical subclumps. This scenario is somewhat suggestive of a cluster merger.
Moreover, while previous studies did not find any direct evidence of substructure in the X-ray emission (Ota & Mitsuda 2004; Pedersen & Dahle 2007), our detailed analysis of Chandra data suggests the presence of multiple clumps. The elliptical β-model residuals resemble the residuals computed by Girardi et al. (2010b) from the fit of the X-ray photon distribution of the cluster Abell 2294 (see their Fig. 12) with a simple β-model. For Abell 2294, Girardi et al. (2010b) explain the residual image by the presence of two very closely projected subsystems. Our Fig. 15 suggests a similar scenario for A1995, with an excess of X-ray emission (positive residuals) in the NE-SW direction. The main central X-ray peak is close to the BCG. This peak and a SW one are offset with respect to the two main optical peaks and located between them, thus resembling the usual situation of a bimodal merging just after the core-core passage with the collisional X-ray components slowed down with respect to the collisionless galaxy clumps. The NE X-ray peak lies between the main optical peak and the third (minor) optical peak, thus suggesting that a third subcluster intervenes in the merger. A fourth X-ray peak (excess of positive residuals) at the NW is less significant and is not considered. Summarizing, our results confirm the active dynamical state of A1995 from the thermodynamic point of view.
5.2. Merger kinematics and diffuse radio sources
Considering only the two main subclusters, the merger can be followed through the analytic method of the bimodal model (Beers et al. 1982; see also Boschin et al. 2010). For the values of the relevant parameters (D; Msys; ΔVrf,LOS), we used the values reported above taking both the cases corresponding to 1D- and 3D-KMM analysis into account (hereafter case-1D and case-3D). We assumed t = 0.2 Gyr for the time elapsed from the core crossing (a typical value for clusters hosting radio halos; e.g. Markevitch et al. 2002; Girardi et al. 2008). Figure 16 illustrates the solutions of the bimodal model, where the mass of the system Msys is plotted against α, the projection angle between the direction defined by the subclumps and the plane of the sky. In both case-1D and case-3D we find a bound outgoing solution (BO, see Fig. 16) compatible with α ~ 50°. This value agrees with the strong evidence of substructure in the 3D analyses, since 3D substructure is more easily detected at intermediate angles (Pinkney et al. 1996). Note that the assumption of significantly longer times t would lead to larger, unlikely, angles of view (e.g. >70° for t > 1 Gyr).
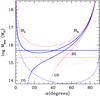 |
Fig. 16 System mass – projection angle diagram of the analytic bimodal model applied to the two subclusters. Thin/red (thick/blue) lines refer to the case-1D (case-3D; see text). In particular, bound (solid curves) and incoming (collapsing; BIa and BIb), bound outgoing (expanding; BO), and unbound (dashed curves) outgoing (UO) solutions are shown. The horizontal lines give the computed values of the system mass for the two cases. The dotted curves separate bound and unbound regions (above and below the dotted curves, respectively). |
As a comparison with the results in the radio band, Giovannini et al. (2009) show that, as usual, the radio halo of A1995 and the X-ray emitting ICM occupy the cluster volume in the same manner (see their Fig. 8 and our Fig. 1). We find that the elongation of the radio halo roughly agrees with the direction of the merger, as detected in several clusters, e.g. the Bullet Cluster (1E0657-56; Markevitch et al. 2002) and Abell 520 (Girardi et al. 2008); but see Abell 523 (Giovannini et al. 2011).
In conclusion, A1995, for its high mass and cluster merging evidence, is not atypical among clusters hosting radio halos. The remaining puzzling point concerns the dark matter distribution, which is quite circularly symmetric with respect to the galaxy distribution (Dahle et al. 2002; Holhjem et al. 2009), the latter indicating a NE-SW preferential direction. Owing to the assumed collisionless nature of both galaxies and dark matter particles, this is surprising evidence. Moreover, this disagrees with the results found for other extensively studied clusters, such as the Bullet Cluster (e.g., Markevitch et al. 2002) or clusters CL 0152-1357 and MS 1054-0321 (Jee et al. 2005a,b), where a coincidence is found between the galaxy and dark matter distributions. Nevertheless, the peculiarity of A1995 is not so extreme as in other clusters, such as CL 0024+17, where evidence was found for a dark matter ring (Jee et al. 2007) without a obvious galaxy counterpart (Qin et al. 2008; but see also Ponente & Diego 2011, who suggest that dark matter ringlike structures could be due to systematics in lensing reconstruction). In any case, the observed dichotomy between the dark matter and galaxy distributions makes A1995 an appealing target for future studies.
Online material
Catalog of 126 galaxies in the field of A1995 with measured radial velocities, where † highlights the ID of the BCG.
See http://iraf.net
Acknowledgments
M.G. acknowledges financial support from ASI-INAF (I/088/06/0 grant) and PRININAF2010. This work has been supported by the Programa Nacional de Astronomía y Astrofísica of the Spanish Ministry of Science and Innovation under grants AYA2010-21322-C03-02, AYA2007-67965-C03-01, and AYA2010-21887-C04-04. This publication is based on observations made with the Telescopio Nazionale Galileo (TNG) and the Isaac Newton Telescope (INT). The TNG is operated by the Fundación Galileo Galilei – INAF. The INT is operated by the Isaac Newton Group. Both telescopes are located in the Spanish Observatorio of the Roque de Los Muchachos of the Instituto de Astrofisica de Canarias (island of La Palma, Spain). This research made use of the NASA/IPAC Extragalactic Database (NED), operated by the Jet Propulsion Laboratory (California Institute of Technology), under contract with the National Aeronautics and Space Administration. This research is also partly based on photometric data of the Sloan Digital Sky Survey (SDSS). Funding for the SDSS has been provided by the Alfred P. Sloan Foundation, the Participating Institutions, the National Aeronautics and Space Administration, the National Science Foundation, the U.S. Department of Energy, the Japanese Monbukagakusho, and the Max Planck Society. The SDSS Web site is http://www.sdss.org/. The SDSS is managed by the Astrophysical Research Consortium for the Participating Institutions. The Participating Institutions are the American Museum of Natural History, Astrophysical Institute Potsdam, University of Basel, University of Cambridge, Case Western Reserve University, University of Chicago, Drexel University, Fermilab, the Institute for Advanced Study, the Japan Participation Group, Johns Hopkins University, the Joint Institute for Nuclear Astrophysics, the Kavli Institute for Particle Astrophysics and Cosmology, the Korean Scientist Group, the Chinese Academy of Sciences (LAMOST), Los Alamos National Laboratory, the Max-Planck-Institute for Astronomy (MPIA), the Max-Planck-Institute for Astrophysics (MPA), New Mexico State University, Ohio State University, University of Pittsburgh, University of Portsmouth, Princeton University, the United States Naval Observatory, and the University of Washington.
References
- Abell, G. O., Corwin, H. G. Jr., & Olowin, R. P. 1989, ApJS, 70, 1 [NASA ADS] [CrossRef] [EDP Sciences] [Google Scholar]
- Ashman, K. M., Bird, C. M., & Zepf, S. E. 1994, AJ, 108, 2348 [NASA ADS] [CrossRef] [Google Scholar]
- Baldi, A., Ettori, S., Mazzotta, P., Tozzi, P., & Borgani, S. 2007, ApJ, 666, 835 [NASA ADS] [CrossRef] [Google Scholar]
- Basu, K. 2012, MNRAS, 421, L112 [NASA ADS] [CrossRef] [Google Scholar]
- Beers, T. C., Geller, M. J., & Huchra, J. P. 1982, ApJ, 257, 23 [NASA ADS] [CrossRef] [Google Scholar]
- Beers, T. C., Flynn, K., & Gebhardt, K. 1990, AJ, 100, 32 [NASA ADS] [CrossRef] [Google Scholar]
- Beers, T. C., Forman, W., Huchra, J. P., Jones, C., & Gebhardt, K. 1991, AJ, 102, 1581 [NASA ADS] [CrossRef] [Google Scholar]
- Beers, T. C., Gebhardt, K., Huchra, J. P., et al. 1992, ApJ, 400, 410 [NASA ADS] [CrossRef] [Google Scholar]
- Bird, C. M., & Beers, T. C. 1993, AJ, 105, 1596 [NASA ADS] [CrossRef] [Google Scholar]
- Böhringer, H., Voges, W., Huchra, J. P., et al. 2000, ApJS, 129, 435 [NASA ADS] [CrossRef] [Google Scholar]
- Bonamente, M., Joy, M., LaRoque, S. J., et al. 2008, ApJ, 675, 106 [NASA ADS] [CrossRef] [Google Scholar]
- Boschin, W., Girardi, M., Barrena, R., et al. 2004, A&A, 416, 839 [NASA ADS] [CrossRef] [EDP Sciences] [Google Scholar]
- Boschin, W., Barrena, R., & Girardi, M. 2010, A&A, 521, A78 [NASA ADS] [CrossRef] [EDP Sciences] [Google Scholar]
- Boschin, W., Girardi, M., Barrena, R., & Nonino, M. 2012, A&A, 540, A43 (B12) [NASA ADS] [CrossRef] [EDP Sciences] [Google Scholar]
- Brunetti, G., Venturi, T., Dallacasa, D., et al. 2007, ApJ, 670, L5 [NASA ADS] [CrossRef] [Google Scholar]
- Brunetti, G., Cassano, R., Dolag, K., & Setti, G. 2009, A&A, 507, 661 [NASA ADS] [CrossRef] [EDP Sciences] [Google Scholar]
- Buote, D. A. 2002, in Merging Processes in Galaxy Clusters, Optical Analysis of Cluster Mergers, eds. L. Feretti, I. M. Gioia, & G. Giovannini (The Netherlands: Kluwer Ac. Pub.) [Google Scholar]
- Buote, D. A., & Tsai, J. C. 1996, ApJ, 458, 27 [NASA ADS] [CrossRef] [Google Scholar]
- Cash, W. 1979, ApJ, 228, 939 [NASA ADS] [CrossRef] [Google Scholar]
- Cassano, R., Brunetti, G., & Setti, G. 2006, MNRAS, 369, 1577 [NASA ADS] [CrossRef] [Google Scholar]
- Cassano, R., Ettori, S., Giacintucci, S., et al. 2010, ApJ, 721, 82 [Google Scholar]
- Cooray, A. R., Grego, L., Holzapfel, W. L., et al. 1998, AJ, 115, 1388 [Google Scholar]
- Cousins, A. W. J., 1976, Mem. R. Astron. Soc., 81, 25 [Google Scholar]
- Dahle, H., Kaiser, N., Irgens, R. J., Lilje, P. B., & Maddox, S. J. 2002, ApJS, 139, 313 [NASA ADS] [CrossRef] [Google Scholar]
- den Hartog, R., & Katgert, P. 1996, MNRAS, 279, 349 [NASA ADS] [CrossRef] [Google Scholar]
- Dressler, A. 1980, ApJ, 236, 351 [NASA ADS] [CrossRef] [Google Scholar]
- Dressler, A., & Shectman, S. A. 1988, AJ, 95, 985 [NASA ADS] [CrossRef] [Google Scholar]
- Ehlert, S., & Ulmer, M. P. 2009, A&A, 503, 35 [NASA ADS] [CrossRef] [EDP Sciences] [Google Scholar]
- Ensslin, T. A., Biermann, P. L., Klein, U., & Kohle, S. 1998, A&A, 332, 395 [NASA ADS] [Google Scholar]
- Fadda, D., Girardi, M., Giuricin, G., Mardirossian, F., & Mezzetti, M. 1996, ApJ, 473, 670 [NASA ADS] [CrossRef] [Google Scholar]
- Fasano, G., & Franceschini, A. 1987, MNRAS, 225, 155 [NASA ADS] [CrossRef] [Google Scholar]
- Feretti, L. 1999, MPE Rep., 271 [Google Scholar]
- Ferrari, C., Maurogordato, S., Cappi, A., & Benoist, C. 2003, A&A, 399, 813 [NASA ADS] [CrossRef] [EDP Sciences] [Google Scholar]
- Ferrari, C., Govoni, F., Schindler, S., Bykov, A. M., & Rephaeli, Y. 2008, Space Sci. Rev., 134, 93 [NASA ADS] [CrossRef] [Google Scholar]
- Giovannini, G., & Feretti, L. 2002, in Merging Processes in Galaxy Clusters, Diffuse Radio Sources and Cluster Mergers, eds. L. Feretti, I. M. Gioia, & G. Giovannini (The Netherlands: Kluwer Ac. Pub.) [Google Scholar]
- Giovannini, G., Bonafede, A., Feretti, L., et al. 2009, A&A, 507, 1257 [NASA ADS] [CrossRef] [EDP Sciences] [Google Scholar]
- Giovannini, G., Feretti, L., Girardi, M., et al. 2011, A&A, 530, L5 [NASA ADS] [CrossRef] [EDP Sciences] [Google Scholar]
- Girardi, M., & Biviano, A. 2002, in Merging Processes in Galaxy Clusters, Optical Analysis of Cluster Mergers, eds. L. Feretti, I. M. Gioia, & G. Giovannini (The Netherlands: Kluwer Ac. Pub.) [Google Scholar]
- Girardi, M., & Mezzetti, M. 2001, ApJ, 548, 79 [NASA ADS] [CrossRef] [Google Scholar]
- Girardi, M., Fadda, D., Giuricin, G. et al. 1996, ApJ, 457, 61 [NASA ADS] [CrossRef] [Google Scholar]
- Girardi, M., Escalera, E., Fadda, D., et al. 1997, ApJ, 482, 11 [Google Scholar]
- Girardi, M., Barrena, R., Boschin, W., & Ellingson, E. 2008, A&A, 491, 379 [NASA ADS] [CrossRef] [EDP Sciences] [Google Scholar]
- Girardi, M., Barrena, R., & Boschin, W. 2010a, Contribution to the conference Galaxy clusters: observations, physics and cosmology, held in Garching, Germany, July 26–30, 2010, http://www.mpa-garching.mpg.de/~clust10/ [Google Scholar]
- Girardi, M., Boschin, W., & Barrena, R. 2010b, A&A, 517, A65 [NASA ADS] [CrossRef] [EDP Sciences] [Google Scholar]
- Girardi, M., Bardelli, S., Barrena, R., et al. 2011, A&A, 536, A89 [NASA ADS] [CrossRef] [EDP Sciences] [Google Scholar]
- Goto, T., Sekiguchi, M., Nichol, R. C., et al. 2002, AJ, 123, 1807 [NASA ADS] [CrossRef] [Google Scholar]
- Govoni, F., Ensslin, T. A., Feretti, L., & Giovannini, G. 2001, A&A, 369, 441 [NASA ADS] [CrossRef] [EDP Sciences] [Google Scholar]
- Hart, B. 2008, Ph.D. Thesis [arXiv:0801.4093] [Google Scholar]
- Hoeft, M., Brüggen, M., & Yepes, G. 2004, MNRAS, 347, 389 [NASA ADS] [CrossRef] [Google Scholar]
- Holhjem, K., Schirmer, M., & Dahle, H. 2009, A&A, 504, 1 [NASA ADS] [CrossRef] [EDP Sciences] [Google Scholar]
- Irgens, R. J., Lilje, P. B., Dahle, H., & Maddox, S. J. 2002, ApJ, 579, 227 [NASA ADS] [CrossRef] [Google Scholar]
- Jee, M. J., White, R. L., Benítez, N., et al. 2005a, ApJ, 618, 46 [NASA ADS] [CrossRef] [Google Scholar]
- Jee, M. J., White, R. L., Ford, H. C., et al. 2005b, ApJ, 634, 813 [NASA ADS] [CrossRef] [Google Scholar]
- Jee, M. J., Ford, H. C., Illingworth, G. D., et al. 2007, ApJ, 661, 728 [NASA ADS] [CrossRef] [Google Scholar]
- Johnson, H. L., & Morgan, W. W. 1953, ApJ, 117, 313 [NASA ADS] [CrossRef] [Google Scholar]
- Markevitch, M., Gonzalez, A. H., David, L., et al. 2002, ApJ, 567, L27 [NASA ADS] [CrossRef] [Google Scholar]
- Ota, N., & Mitsuda, K. 2004, A&A, 428, 757 [NASA ADS] [CrossRef] [EDP Sciences] [Google Scholar]
- Owen, F., Morrison, G., & Voges, W. 1999, Proceedings of the workshop Diffuse Thermal and Relativistic Plasma in Galaxy Clusters, eds. H. Böhringer, L. Feretti, & P. Schuecker, MPE Rep., 271, 9 [Google Scholar]
- Patel, S. K., Joy, M., Carlstrom, J. E., et al. 2000, ApJ, 541, 37 [NASA ADS] [CrossRef] [Google Scholar]
- Pedersen, K., & Dahle, H. 2007, ApJ, 667, 26 [NASA ADS] [CrossRef] [Google Scholar]
- Pinkney, J., Roettiger, K., Burns, J. O., & Bird, C. M. 1996, ApJS, 104, 1 [NASA ADS] [CrossRef] [Google Scholar]
- Pisani, A. 1993, MNRAS, 265, 706 [NASA ADS] [Google Scholar]
- Pisani, A. 1996, MNRAS, 278, 697 [NASA ADS] [CrossRef] [Google Scholar]
- Ponente, P. P., & Diego, J. M. 2011, A&A, 535, A119 [NASA ADS] [CrossRef] [EDP Sciences] [Google Scholar]
- Qin, B., Shan, H.-Y., & Tilquin, A. 2008, ApJ, 679, L81 [NASA ADS] [CrossRef] [Google Scholar]
- Roettiger, K., Loken, C., & Burns, J. O. 1997, ApJS, 109, 307 [NASA ADS] [CrossRef] [Google Scholar]
- Rossetti, M., Eckert, D., Cavalleri, B. M., et al. 2011, A&A, 532, A123 [NASA ADS] [CrossRef] [EDP Sciences] [Google Scholar]
- Schlegel, D. J., Finkbeiner, D. P., & Davis, M. 1998, ApJ, 500, 525 [NASA ADS] [CrossRef] [Google Scholar]
- Serna, A., & Gerbal, D. 1996, A&A, 309, 65 [NASA ADS] [Google Scholar]
- Tonry, J., & Davis, M. 1979, ApJ, 84, 1511 [Google Scholar]
- Venturi, T. 2011, Mem. SAIt, 82, 499 [Google Scholar]
- West, M. J., & Bothun, G. D. 1990, ApJ, 350, 36 [NASA ADS] [CrossRef] [Google Scholar]
All Tables
Catalog of 126 galaxies in the field of A1995 with measured radial velocities, where † highlights the ID of the BCG.
All Figures
|
Fig. 1 Optical/X-ray/radio view of A1995 (direct sky view with north up). A smoothed Chandra 0.3−7 keV image (orange and yellow colors) of A1995 is superimposed on an RH-band image taken with the INT. Thin contours are the radio contour levels from Giovannini et al. (2009; VLA data at 1.4 GHz with discrete sources subtracted, courtesy of Govoni). Thick contours are the mass distribution contours from Holhjem et al. (2009). Numbers highlight notable galaxies mentioned in the text. |
| In the text | |
|
Fig. 2 Field of the cluster A1995 (direct sky view with north up) observed with the INT in the RH-band. Cluster members are indicated by circles, while nonmember galaxies are shown by squares (see Table 1). Numbers highlight the IDs of notable galaxies as in Fig. 1. |
| In the text | |
|
Fig. 3 Histogram of 126 galaxy redshifts. The 94 (provisional) cluster members are highlighted with the solid line (see text). |
| In the text | |
|
Fig. 4 The 94 (provisional) cluster members (see also Fig. 3) in the phase space (see top panel). The ordinate is the rest-frame velocity, the abscissa the projected clustercentric distance. Galaxies rejected by the “shifting gapper” procedure are shown with (red) crosses. For the cluster center we adopt the location of the BCG (see text). Big green circles and small points show the differential and integral profiles of the mean velocity (in the middle panel) and the radial velocity dispersion (in the bottom panel). In the bottom panel, two horizontal lines mark the range of possible values for the ICM temperature (7−9 keV) with their respective errors transformed to σV (see Sect. 5 for details). |
| In the text | |
|
Fig. 5 The 87 galaxies recognized as cluster members. Top panel: radial velocity distribution with the arrow indicating the velocity of the BCG. Red and blue Gaussians are the best two-group partition fits according to the 1D-KMM test (see text). Bottom panel: stripe density plot. The position of the significant gap is marked by an arrow. |
| In the text | |
|
Fig. 6 2D distribution of 87 cluster members. Galaxies with smaller (larger) symbols have higher (lower) radial velocities. Blue circles and red crosses identify galaxies of GV1 and GV2. The origin of the coordinates is the location of the BCG. The solid and dashed lines indicate the position angle of the cluster velocity gradient (see text) and relative errors, respectively. |
| In the text | |
|
Fig. 7 Isodensity contours of the cluster members spatial distribution computed with 2D-DEDICA. The origin of the coordinates is the location of the BCG (the big cross). Small circles mark the positions of cluster members relative to the BCG. |
| In the text | |
|
Fig. 8 B − R vs. R diagram for the 126 galaxies with spectroscopic information. Small black squares are cluster members, while big red squares represent field galaxies. The solid line shows the best-fit CMR as computed from cluster members; the dashed lines mark the region where likely cluster members were selected from the photometric catalogs. |
| In the text | |
|
Fig. 9 Results of the 2D-DEDICA method (blue isodensity contour lines) applied to likely A1995 members (see text) with R < 21. The origin of the coordinates is the location of the BCG (the big cross). Small circles mark the positions of likely cluster members relative to the BCG. |
| In the text | |
|
Fig. 10 Positions on the plane of the sky of 87 cluster members (marked by bubbles). Top panel: DS-test bubble plot for the deviation δV,i and Nnn = 40 (see text for an explanation). Bottom panel: as above, but for the deviation δs,i and Nnn = 10. In both panels, thin/blue (thick/red) bubbles show regions with a local value lower (higher) than the global one. |
| In the text | |
|
Fig. 11 2D distribution of 87 cluster members. Galaxies with smaller (larger) symbols have higher (lower) radial velocities. Big blue circles and red crosses indicate galaxies of KMM3D-1 and KMM3D-2. The insert plot shows the same velocity distribution of Fig. 5 and the two Gaussians corresponding to the mean velocity and velocity dispersions of KMM3D-1 and KMM3D-2 (blue thin line and red thick line, respectively). |
| In the text | |
|
Fig. 12 Results obtained with the Htree method (see text). In this dendogram, the horizontal axis reports the binding energy while the vertical axis shows the IDms of the member galaxies (as in Table 1). |
| In the text | |
|
Fig. 13 2D distribution of 87 cluster members. Big blue circles and red crosses indicate galaxies of HT1 (main system) and HT2 (high-velocity subcluster). The insert plot shows the same velocity distribution of Fig. 5 (dashed line) and that of HT1 (blue thin line) and HT2 (red thick line). The subcluster HT12 of HT1 is indicated by small blue crosses in the main plot and this causes the low-velocity tail in the insert plot. |
| In the text | |
|
Fig. 14 Chandra image of A1995 (smoothed X-ray emission in the energy band 0.3–7 keV, direct sky view with north up). The field of view is 8.5′ × 8.5′. |
| In the text | |
|
Fig. 15 The smoothed X-ray emission of A1995 (direct sky view with north up). Black (white) contours show the positive (negative) elliptical β-mode residuals. Big crosses indicate the two main optical clumps detected with the 2D-DEDICA method (2D-NE and 2D-SW in Table 3). Small cross indicates the third densest peak we detect (2D-NENE). |
| In the text | |
|
Fig. 16 System mass – projection angle diagram of the analytic bimodal model applied to the two subclusters. Thin/red (thick/blue) lines refer to the case-1D (case-3D; see text). In particular, bound (solid curves) and incoming (collapsing; BIa and BIb), bound outgoing (expanding; BO), and unbound (dashed curves) outgoing (UO) solutions are shown. The horizontal lines give the computed values of the system mass for the two cases. The dotted curves separate bound and unbound regions (above and below the dotted curves, respectively). |
| In the text | |
Current usage metrics show cumulative count of Article Views (full-text article views including HTML views, PDF and ePub downloads, according to the available data) and Abstracts Views on Vision4Press platform.
Data correspond to usage on the plateform after 2015. The current usage metrics is available 48-96 hours after online publication and is updated daily on week days.
Initial download of the metrics may take a while.