Fig. 13
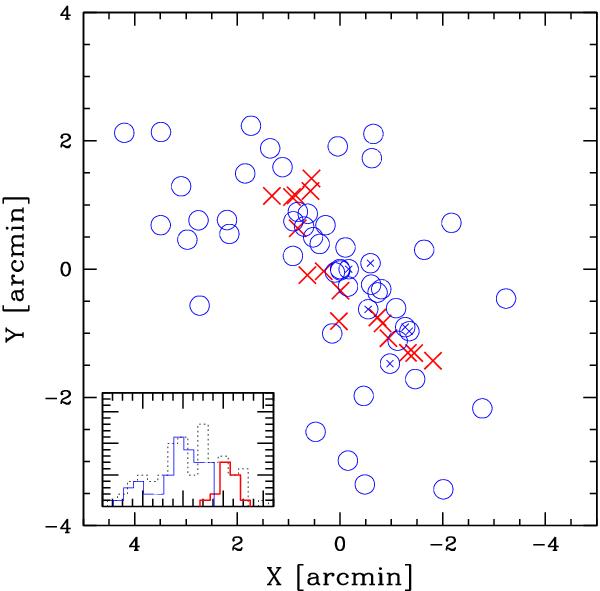
2D distribution of 87 cluster members. Big blue circles and red crosses indicate galaxies of HT1 (main system) and HT2 (high-velocity subcluster). The insert plot shows the same velocity distribution of Fig. 5 (dashed line) and that of HT1 (blue thin line) and HT2 (red thick line). The subcluster HT12 of HT1 is indicated by small blue crosses in the main plot and this causes the low-velocity tail in the insert plot.
Current usage metrics show cumulative count of Article Views (full-text article views including HTML views, PDF and ePub downloads, according to the available data) and Abstracts Views on Vision4Press platform.
Data correspond to usage on the plateform after 2015. The current usage metrics is available 48-96 hours after online publication and is updated daily on week days.
Initial download of the metrics may take a while.