Fig. 16
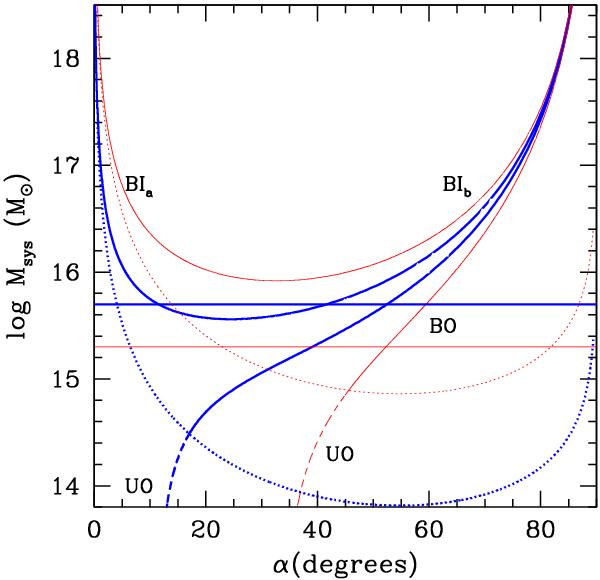
System mass – projection angle diagram of the analytic bimodal model applied to the two subclusters. Thin/red (thick/blue) lines refer to the case-1D (case-3D; see text). In particular, bound (solid curves) and incoming (collapsing; BIa and BIb), bound outgoing (expanding; BO), and unbound (dashed curves) outgoing (UO) solutions are shown. The horizontal lines give the computed values of the system mass for the two cases. The dotted curves separate bound and unbound regions (above and below the dotted curves, respectively).
Current usage metrics show cumulative count of Article Views (full-text article views including HTML views, PDF and ePub downloads, according to the available data) and Abstracts Views on Vision4Press platform.
Data correspond to usage on the plateform after 2015. The current usage metrics is available 48-96 hours after online publication and is updated daily on week days.
Initial download of the metrics may take a while.