Fig. 11
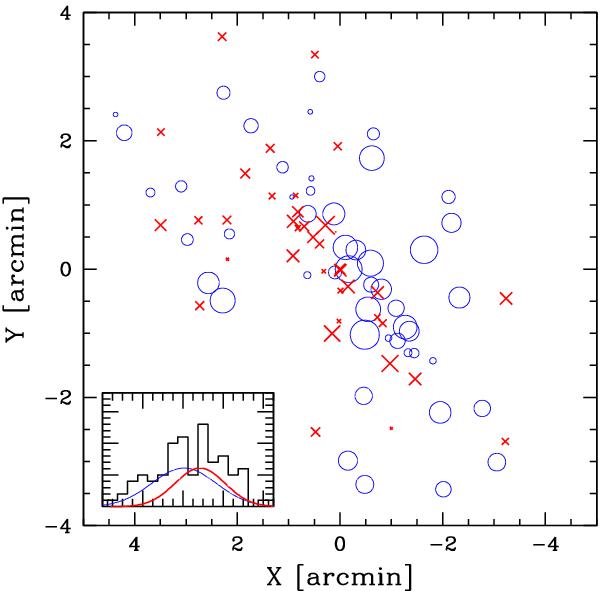
2D distribution of 87 cluster members. Galaxies with smaller (larger) symbols have higher (lower) radial velocities. Big blue circles and red crosses indicate galaxies of KMM3D-1 and KMM3D-2. The insert plot shows the same velocity distribution of Fig. 5 and the two Gaussians corresponding to the mean velocity and velocity dispersions of KMM3D-1 and KMM3D-2 (blue thin line and red thick line, respectively).
Current usage metrics show cumulative count of Article Views (full-text article views including HTML views, PDF and ePub downloads, according to the available data) and Abstracts Views on Vision4Press platform.
Data correspond to usage on the plateform after 2015. The current usage metrics is available 48-96 hours after online publication and is updated daily on week days.
Initial download of the metrics may take a while.