Fig. 5
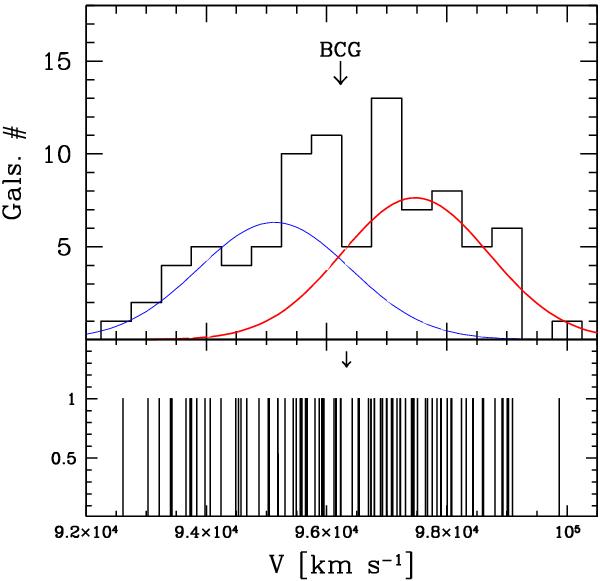
The 87 galaxies recognized as cluster members. Top panel: radial velocity distribution with the arrow indicating the velocity of the BCG. Red and blue Gaussians are the best two-group partition fits according to the 1D-KMM test (see text). Bottom panel: stripe density plot. The position of the significant gap is marked by an arrow.
Current usage metrics show cumulative count of Article Views (full-text article views including HTML views, PDF and ePub downloads, according to the available data) and Abstracts Views on Vision4Press platform.
Data correspond to usage on the plateform after 2015. The current usage metrics is available 48-96 hours after online publication and is updated daily on week days.
Initial download of the metrics may take a while.