Free Access
Fig. 12
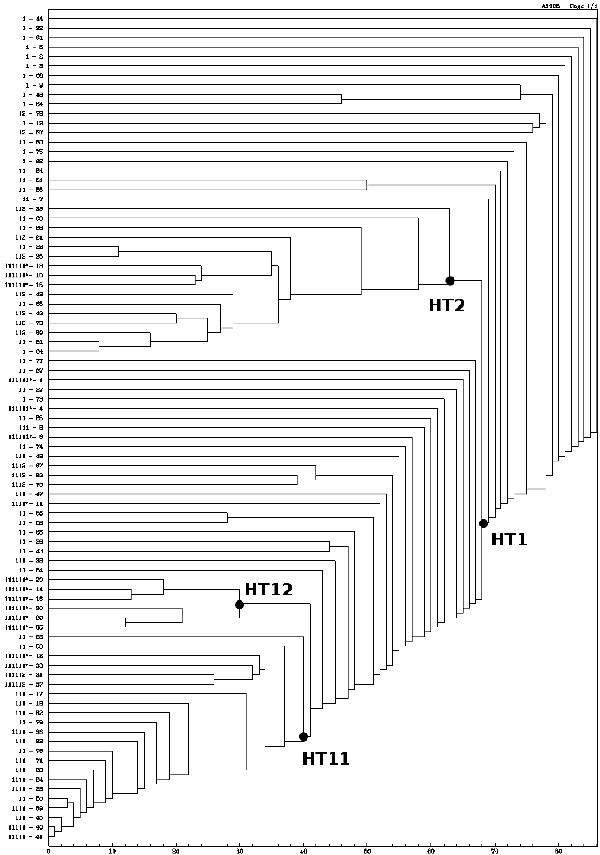
Results obtained with the Htree method (see text). In this dendogram, the horizontal axis reports the binding energy while the vertical axis shows the IDms of the member galaxies (as in Table 1).
Current usage metrics show cumulative count of Article Views (full-text article views including HTML views, PDF and ePub downloads, according to the available data) and Abstracts Views on Vision4Press platform.
Data correspond to usage on the plateform after 2015. The current usage metrics is available 48-96 hours after online publication and is updated daily on week days.
Initial download of the metrics may take a while.