Fig. 4
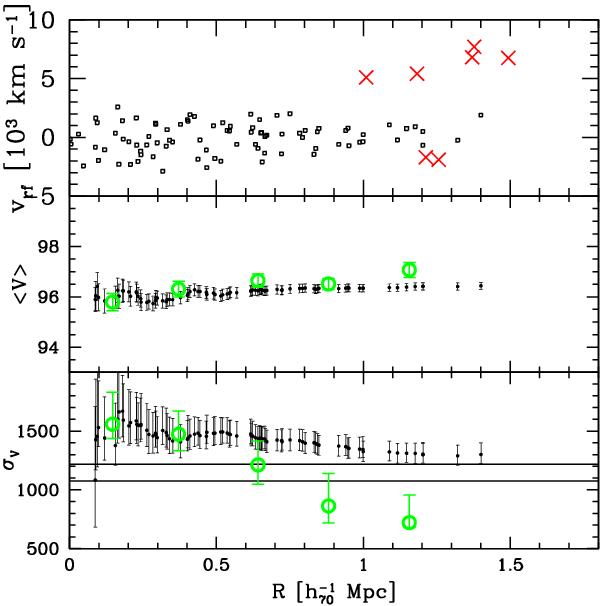
The 94 (provisional) cluster members (see also Fig. 3) in the phase space (see top panel). The ordinate is the rest-frame velocity, the abscissa the projected clustercentric distance. Galaxies rejected by the “shifting gapper” procedure are shown with (red) crosses. For the cluster center we adopt the location of the BCG (see text). Big green circles and small points show the differential and integral profiles of the mean velocity (in the middle panel) and the radial velocity dispersion (in the bottom panel). In the bottom panel, two horizontal lines mark the range of possible values for the ICM temperature (7−9 keV) with their respective errors transformed to σV (see Sect. 5 for details).
Current usage metrics show cumulative count of Article Views (full-text article views including HTML views, PDF and ePub downloads, according to the available data) and Abstracts Views on Vision4Press platform.
Data correspond to usage on the plateform after 2015. The current usage metrics is available 48-96 hours after online publication and is updated daily on week days.
Initial download of the metrics may take a while.