| Issue |
A&A
Volume 547, November 2012
|
|
|---|---|---|
| Article Number | A80 | |
| Number of page(s) | 21 | |
| Section | Galactic structure, stellar clusters and populations | |
| DOI | https://doi.org/10.1051/0004-6361/201219374 | |
| Published online | 01 November 2012 | |
Spectroscopy of very low-mass stars and brown dwarfs in the Lambda Orionis star-forming region
II. Rotation, activity and other properties of spectroscopically confirmed members of Collinder 69⋆,⋆⋆
1 European Southern Observatory, Alonso de Córdova 3107, Vitacura, Santiago, Chile
e-mail: This email address is being protected from spambots. You need JavaScript enabled to view it.
2 Calar Alto Observatory, Centro Astronómico Hispano Alemán, C/Jesús Durbán Remón, 2-2, 04004 Almería, Spain
3 Depto. Astrofísica, Centro de Astrobiología (INTA-CSIC), PO Box 78, 28691 Villanueva de la Cañada, Spain
4 Spitzer Science Center, California Institute of Technology, Pasadena, CA 91125, USA
5 INAF – Osservatorio Astronomico di Palermo, Piazza del Parlamento 1, 90134 Palermo, Italy
Received: 9 April 2012
Accepted: 3 September 2012
Abstract
Context. Most observational studies conducted so far point toward brown dwarfs sharing a similar formation mechanism as the one that is accepted for low-mass stars. However, larger databases and more systematic studies are needed before strong conclusions can be reached.
Aims. In this second paper of a series devoted to studying the spectroscopic properties of the Lambda Orionis star-forming region members, we study accretion, activity and rotation for a wide set of spectroscopically confirmed members of the central star cluster Collinder 69 to assess analogies and/or differences between the brown-dwarf and stellar populations of this cluster. Moreover, we present comparisons with other star-forming regions of similar and different ages to address environmental effects on our conclusions.
Methods. We studied prominent photospheric lines to derive rotational velocities and emission lines to distinguish between accretion processes and chromospheric activity. In addition, we include information about disk presence and X-ray emission.
Results. We report very strong differences in the disk fractions of low-mass stars and brown dwarfs (~58%) when compared to higher mass stars (26-3+4%), with 0.6 M⊙ being the critical mass we find for this dichotomy. As a byproduct, we address the implications of the spatial distribution of disk and diskless members in the formation scenario of the cluster itself. We used the Hα emission to distinguish among accreting and non-accreting sources, finding that 38-7+8% of sources harboring disks undergo active accretion and that his percentage stays similar in the substellar regime. For these sources we have estimated accretion rates. Finally, regarding rotational velocities, we find a high dispersion in vsin(i) that is even higher among the diskless population.
Key words: accretion, accretion disks / stars: pre-main sequence / stars: variables: T Tauri, Herbig Ae/Be / brown dwarfs / circumstellar matter / stars: low-mass
Based on the ESO observing programs 080.C-0592 and 078.C-0124; and observing programs from Calar Alto, Keck, Subaru, and Magellan.
Appendices A and Table 6 are available in electronic form at http://www.aanda.org
© ESO, 2012
1. Introduction
This is the second paper of a series devoted to studying, from a spectroscopic point of view, the young population present in several associations belonging to the Lambda Orionis star-forming region (LOSFR). In this paper, we systematically analyze several properties of the confirmed members of the central cluster Collinder 69 (C69); including the presence of disks, accretion onto the central star/brown dwarf, rotation, and activity.
In Bayo et al. (2011, from now on Paper I), we presented a very detailed and complete spectroscopic census of Collinder 69; the oldest (~5–12 Myr) of the associations belonging to the LOSFR. In short, this star-forming region is located at ~400 pc (Murdin & Penston 1977), representing the head of the Orion giant. Its center is dominated by the O8III multiple star λ Orionis and comprises both recently formed stars from 0.2 M⊙ to 24 M⊙ and dark clouds that are actively forming stars.
The main goals of this paper are to study in detail the properties of the C69 confirmed members (e.g. rotation, activity, disk fractions, and accretion rates), analyze the different populations within the cluster, and compare our results with other low-mass star-forming regions of similar and different ages. Indeed, the evolutionary status of C69 seems to be especially suited to studying disk evolution and accretion at the low end of the mass spectrum. According to our observations, in almost every bin in mass (for masses lower or equal to 0.6 M⊙, ~3700 K assuming th 5 Myr isochrone from Baraffe et al. 1998), we find a diversity of disk-harboring sources: from those with optically thick disks that undergo active accretion (onto the central star) to others that have completely lost their primordial circumstellar disks. Finally, and as a byproduct of this study, we put our findings in context of the current theory of how the LOSFR as a whole was formed (triggered by a supernova, see Dolan & Mathieu 2001, and more discussion on this scenario on Paper I).
This paper is organized as follows: in Sect. 2 we provide a description of the data. In Sects. 3 to 5 properties such as rotation velocity, activity levels, accretion processes, disks, variability, and spatial distribution of the population of C69 are studied. And, finally, our summary and conclusions are presented in Sect. 6.
Unlike in Paper I, we have grouped the most interesting/ puzzling objects into different categories (following the subsections of Sects. 3 and 4) and discuss their peculiarities in Appendix A.
2. Observations and data analysis
We used an extensive spectral database that our group has been gathering during more than seven years and that is described in Paper I. Furthermore, we used the measurements and parameters derived for confirmed members published in Dolan & Mathieu (1999, 2001); Barrado y Navascués et al. (2007); Sacco et al. (2008); Maxted et al. (2008); Morales-Calderón (2008); Bayo (2009); Barrado et al. (2011) and Franciosini & Sacco (2011).
2.1. Spectroscopic database
In total, we analyzed spectra obtained by us corresponding to ~100 confirmed members, with several objects observed more than once, plus data corresponding to ~70 objects that were studied in at least one of the papers cited before and for which we do not have our own observations.
In short, our own database comprises optical spectra of confirmed members of C69 with temperatures between ~2800 and ~4700 K. The spectra have resolutions in the range 600–11 250, wavelength coverages from ~5000 Å up to ~10 400 Å and have been obtained with different instruments and telescopes at Mauna Kea, Las Campanas, CAHA, and the VLT.
The data reduction of most of our campaigns was performed with IRAF1 following the standard steps. For the analysis of the spectra, motivated by the large amount of data, we developed a tool that for any given set of lines provides in an automatic manner (instrumental-response-corrected) the full width at half maximum (FWHM), full width at ten per cent of the flux (FW10%), and the equivalent widths (EWs). The description of this routine and a study on the effect of the resolution on parameter determination is given in Appendix A of Paper I.
2.2. Photometric and X-ray database
In addition to the spectroscopic database, we used the photometric dataset described in Paper I that is analyzed in detail in Morales-Calderón (2008), Bayo (2009) and Morales-Calderon et al. (in prep.), and of the X-ray data presented in Barrado et al. (2011) and Franciosini & Sacco (2011). The photometric database includes photometry from the optical to the mid-infrared (MIR).
Taking a 5 Myr isochrone as a reference (Baraffe et al. 1998; Chabrier et al. 2000; Allard et al. 2003), the completeness of the optical data is located at ~20 MJup for the whole cluster and even down to ~3 MJup for a field to the east of the center of the cluster. In the near-infrared (NIR), the data are complete down to ~10 MJup in almost the whole cluster and down to ~30 MJup in the outskirts. For the MIR, our database is complete at 3.6 μm down to ~40 MJup.
Finally, the X-ray data are complete down to ~0.3 M⊙ with detections in Barrado et al. (2011) for confirmed members as low as ~0.1 M⊙.
2.3. Fundamental parameter database
We adopted the results from Morales-Calderón (2008) and Barrado y Navascués et al. (2007) regarding the presence of circumstellar disks and substellar analogs. Objects with NIR and/or MIR slope above photospheric values are considered to harbor disks. This slope is analyzed as in Lada et al. (2006) based on the α parameter.
The photometric database described before was used to feed VOSA (Bayo et al. 2008) to determine via spectral energy distribution (SED) fit the effective temperatures and the bolometric luminosities for all confirmed members. These two parameters were used in Paper I, along with theoretical isochrones from the Lyon group (Baraffe et al. 1998; Chabrier et al. 2000; Allard et al. 2003), to determine masses for the confirmed members.
For the mass determination we assumed an age of 5 Myr for C69 since that was the best fit to the produced HR diagram. We note, however, that in Paper I we also set an upperlimit for the age of C69 of 20 Myr. We address this point again in Sect. 5.2.
3. Rotational velocities
For the sample of sources observed with the highest resolution (those observed with Magellan/MIKE, R ~ 11 250; 14 sources in total), we estimated the projected rotational velocity. We added to this sample the objects with vsin(i) determination in Sacco et al. (2008) to study the rotation of ~25 members of C69.
3.1. Technique
We based our determination of the projected rotational velocity on the comparison of the observed spectra with Kurucz models (Castelli et al. 1997) synthesized for different rotational velocities. Because our estimation of vsin(i) is based on comparisons with models of a specific Teff, and there is a known dispersion between effective temperatures based on spectral types and those derived using models (Teff scales, see Paper I), we followed a three-step process:
-
1.
First, we derived Teff and log (g) by comparison with theoretical models. We built a grid of synthetic spectra using different collections: Kurucz (Castelli et al. 1997), NextGen (Hauschildt et al. 1999) and Dusty (Allard et al. 2003) with which we cover effective temperatures in the range 5000–2000 K, assuming solar metallicities, and a range of log (g) between 3.5 and 5.0. We lowered the resolution of both our spectra and the Kurucz models to R ~ 200, which is the resolution provided in the public servers by the Lyon group, to perform a direct fitting process. Table 1 shows the best-fitting set of parameters for each case.
-
2.
Next, we prepared a second grid of high-resolution Kurucz models (those we could generate with the same resolution as our Magellan/MIKE spectra), for different values of vsin(i) for direct comparison. For the comparison we chose the wavelength range from 6090 Å to 6130 Å because the signal-to-noise ratio (S/N) of our spectra was not very high in all cases, and, for the range of temperatures to be analyzed, two of the most prominent photospheric absorption lines (from Ca I) are located within this region. Besides, for the grid of high resolution models, we assume log (g) of 4.0 dex that is a suitable value (according to models) for these young cool confirmed members of C69.
-
3.
Since our high-resolution grid of models did not include models from the Lyon group, we only analyzed sources for which Kurucz was the best choice in step 1, or those for which the difference in reduced χ2 between Kurucz and NextGen was not significant (LOri050, LOri055, LOri057, LOri060, and LOri075). We performed a model fit to the Ca I lines described in step 2 (see Fig. 1) to estimate the rotational velocities of our sources. Prior to this, we included the instrumental response measured on the MIKE lamp arc. The mean FWHM value measured on the lamp spectra was 0.4914 Å, corresponding to a velocity of ~20 km s-1 (the lower limit we can provide for several cases).
Teff, log (g) and rotational velocities derived by comparison with models for the sample of sources observed with Magellan/MIKE.
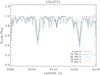 |
Fig. 1 Example of vsin(i) estimation for LOri031. In black we plotted the science spectrum and on top of it with different colors the Kurucz model synthesized for 3750 K, log (g) of 4.0 and five different velocities. The synthetic spectra were produced with the same resolution as the observed one. |
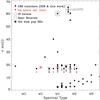 |
Fig. 2 Spectral type vs. vsin(i) for confirmed members of C69 from this work and Sacco et al. (2008) (black dots). For comparison, we include the old-disk population brown dwarfs from Mohanty & Basri (2003) with five pointed star symbols. From the C69 members we highlighted those exhibiting peculiarities: large open squares surround spectroscopic binaries, large open circles represent objects with infrared excess (assumed to be a signpost of the presence of a disk) and red dots were plotted on top of those objects classified as accretors according to the saturation criterion by Barrado y Navascués & Martín (2003) (see text for details). Finally, LOri075 is highlighted with a label and is discussed in Appendix A.1 |
Equivalent width (negative for emission, positive for absorption) of the main lines observed in the spectra obtained with Magellan/MIKE and Keck/LRIS in its low- and high-resolution modes (the three different setups are separated by a double line).
3.2. Main results
The estimated rotational velocities from this work are provided in Table 1 and Table 6, where we add those determined by Sacco et al. (2008). In general, the range of values determined in the two studies agree very well. In particular, there are three sources for which both Sacco et al. (2008) and we have estimated vsin(i). In two of these cases, LOri055 and LOri057, these estimates agree vey well, but for LOri060 we provide a value ~10 km s-1 higher than that obtained by Sacco et al. (2008). For this source, our determination of the rotational velocity suffers because the S/N of the spectrum was the lowest of the sample and, for this reason, the wings of the Ca I doublet are not as “clean” as in the other cases. Therefore, we take their upper-limit of ~20 km s-1 as a more robust measurement.
In Fig. 2, we display the projected rotational velocity as a function of spectral type for those objects where a value of vsin(i) (either calculated by us or from Sacco et al. 2008) is available. Although a significant fraction of the measurements are upper limits, we can see how, as expected given the youth of the sample, the general trend for objects in C69 is to rotate faster than the old-disk population of low-mass stars and brown dwarfs from Mohanty & Basri (2003) (star symbols).
Furthermore, although the dispersion of vsin(i) values among the members of C69 is high; if we consider the NIR and MIR slope as a proxy for disk presence, we see that this dispersion is higher among the diskless population than among disk-harboring sources. Although we are dealing with small number statistics, this could be the result of the disk-locking effect (Bouvier et al. 1997), which explains the dispersion in rotational velocities as a result of different decoupling timescales between the star and the disk.
4. Activity and accretion
Activity, accretion, and mass-loss processes can be studied through the analysis of emission lines in the spectrum of young stellar and substellar objects. We can group these emission lines into two categories: (i) The forbidden emission lines of [OI] (λ5577, 6300, 6364 Å), [SII] (λ6717, 6731 Å) and [NII] (λ6548, 6581 Å) that have been attributed in the literature to low-density regions such as winds, and are therefore a tracer of the mass-loss process (see Shu et al. 1994; Hartmann et al. 1994 and Hartmann 1999). (ii) The permitted emission lines of He I (λ6678 Å), Hα (λ6563 Å) and the CaII triplet (λ8498, 8542, 8662 Å), which are characteristic of classical T Tauri stars and their substellar analogs and trace accretion processes, although they are also known to be signposts of chromospheric activity (Martín et al. 2001; Natta & Testi 2001; Natta et al. 2002; Testi et al. 2002; Mohanty et al. 2003; Jayawardhana et al. 2002b,a, 2003a,b; Barrado y Navascués et al. 2002, 2003; White & Basri 2003).
Given the evolutionary status of the C69 members and the environment where they are located, most of the analyzed spectra show a rich variety of emission lines. We summarize the results from our analysis in the following subsections.
4.1. Spectroscopic emission lines among the C69 sample
For our sample, the forbidden emission lines (given their narrow nature) were only detected in some of the higher resolution spectra (see Tables 2 and 3), but since most of these detections are quite marginal, we cannot be certain whether the signal comes from the source itself or from the nebular environment.
The Ca II triplet was covered in very few of our runs and was only detected in one object (C69-IRAC-005) that is analyzed in detail in Appendix A.2.2.
On the other hand, we have measurement/s of Hα for 156 sources out of the 172 spectroscopically confirmed members. The vast majority of these sources (140 objects, ~90% of the sample) show the line in emission. The EW of this line is used to distinguish between chromospheric or accretion origin of the emission in Sect. 4.3.
We have detected the He I line in 24 objects, all in emission, and we provide the EWs in Tables 2 and 3. All these sources also present intense Hα emission (with a minimum EW of ~5 Å) and six of them are classified as accretors in Sect. 4.3. Regarding the mass range where He I is detected, only six of the sources are in the brown dwarf (BD) domain and the rest have masses above the hydrogen-burning limit.
A more detailed comparison of the He I and Hα EWs of the 24 sources with He I detection shows a clear correlation among them; the stronger the Hα emission, the stronger the He I emission; but our sample is not statistically significant to derive any quantitative relationship between them.
The fact that we detect He I mainly in stars and not in brown dwarfs is not surprising since the typical structure of the He I line is much narrower than that of Hα, for example, and therefore this emission can be hidden if the spectrum does not have high S/N and resolution.
In addition to this technical caveat to detect He I, the extended nebular emission of the cluster has to be taken into account when dealing with fiber spectrographs. In particular, in two cases from the VLT/FLAMES spectra, the helium line may be contaminated by nebular emission (see in Fig. 3 the distribution of the sky fibers and in Sect. 4.3 the quantification of this contamination for the Hα line).
Equivalent width of the main lines observed in the spectra obtained with VLT/FLAMES.
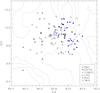 |
Fig. 3 Contours corresponding to a Hα image of C69 (extracted from the Hα six arcmin resolution all sky survey compiled by Finkbeiner 2003). We plotted the location of the C69 members using different symbols (all of them in black, see legend of the figure) according to the instrument with which the individual spectrum was obtained. As can be seen, a significant fraction of the sources have been observed more than once by us. The locations of sky fibers in the VLT/FLAMES campaign are displayed as blue filled dots and the position of Lambda Orionis (roughly marking the center of the cluster) is highlighted with a large blue five-pointed star. |
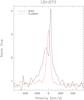 |
Fig. 4 Hα profile of LOri073 observe at high resolution in two different epochs: with VLT/FLAMES (in red, R ~ 8600) in Jan 2008 and with Magellan/MIKE (in black, R ~ 11 250) in Dec 2002. |
Parameters measured and calculated for those sources showing variations in Hα and no significant variability in alkali lines; or variations in Hα that causes them to oscillate between accreting and non-accreting (see text for details).
4.2. Variability connected to activity
Some hints on the chromospheric activity among the late-type population of C69 have already been studied in Paper I through the analysis of the alkali lines. Another clear signpost of activity in young stellar and substellar objects is variability. This variability has been observed not only in the continuum but also in a variety of lines, and its dependence with the spectral type has also been addressed in the literature (examples can be found in Soderblom et al. 1993; Stauffer et al. 1997; Barrado y Navascués et al. 2001). In Paper I, we reported a high percentage ( ≳ 35%) of the members of C69 showing such variability in alkali lines (lithium and sodium).
Most of the sources showing variability in the alkali lines also show variability in the Hα emission, and in Paper I we already demonstrated that the differences we see for example in the EW of the lines, are larger than those we would expect just because we are comparing observations with different spectral resolutions.
On the other hand, we found a couple of objects exhibiting significant variability in Hα and no variability in the alkali lines (see Table 4, the top set of sources). The most extreme example is LOri073; this object not only shows variations in the measured EW of Hα, but also in the profile of the line. As can be seen in Fig. 4, while we observed a single-peak line profile with VLT/FLAMES, a double-peak structure was observed several years before with Magellan/MIKE. This more complex profile is very similar, although narrower, to that presented in Fernández et al. (2004) for the weak-line T Tauri star V410 Tau: we can see the narrow emission peak slightly red-shifted from the rest velocity, as well as the shallower component and the blue-shifted absorption that could suggest the presence of a wind.
Finally, another three particularly interesting variable objects are discussed in Appendix A.2.1. They present the peculiarity that according to one of the Hα measurements, the emission is too high to have a purely chromospheric activity origin (see Table 4, second subset of objects), but for all other measurements this is not the case.
4.3. Hα emission as a proxy for accretion
We note once again that the Hα emission can have different origins, and although it is commonly used as a proxy for active accretion, some considerations have to be taken into account depending on the nature of the source and its surroundings.
First of all, and since cool objects are known to be very active, the Hα emission can be chromospheric and not related to accretion processes. Some limits to this chromospheric contribution have been suggested in the literature: White & Basri (2003) proposed EWs of 10 Å and 20 Å for spectral types K3-M2 and later than M2, respectively. On the other hand, Barrado y Navascués & Martín (2003) proposed a more spectral-dependent relationship mainly focused on late K, M and L dwarfs (and therefore more suitable for our study). This empirical criterion is based on the saturation limit of chromospheric activity ( [L(Hα)/Lbol] = −3.3) and it is shown in Fig. 5 as the boundary to distinguish between accreting and non-accreting stars and brown dwarfs.
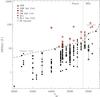 |
Fig. 5 Hα equivalent width versus the effective temperature for confirmed members of C69. We display data from Dolan & Mathieu (1999, 2001) with filled squares, and from Sacco et al. (2008) with filled diamonds. Our data are displayed with solid circles. In every sample, red symbols are used for the sources classified as accretors. Overlapping large circles highlight sources exhibiting excess in the Spitzer/IRAC photometry. For some sources we had more than one epoch of data (either ours or from Dolan & Mathieu 1999, 2001; Sacco et al. 2008). These different measurements for individual objects appear joined with a solid line. The short-dashed line corresponds to the saturation criterion defined by Barrado y Navascués & Martín (2003). A vertical dotted line highlights the substellar frontier for an estimated age of 5 Myr according to the isochrones from the Lyon group. Particular sources discussed in Appendix A.2.2 are highlighted with gray labels. |
On the other hand, when trying to extract accurate measurements from the Hα emission to separate activity and accretion, we are also forced to take into account the environment in which the sources are located. As mentioned before, clusters such as C69 possess a non-negligible nebular component (see Fig. 3), and therefore one has to make sure that the nebular component is subtracted properly from the spectrum of each science target. This is not a problem, for instance, when dealing with long-slit spectroscopy (like most of our campaigns) but can introduce some bias when observing with fiber spectrographs if the “sky fibers” are not placed carefully.
In Fig. 3 we show the contours corresponding to an Hα image (from Finkbeiner 2003, with low spatial resolution ~6′) of the LOSFR, where we highlighted the sources observed with VLT/FLAMES with crosses and the locations of the sky fibers used to correct our measurements with blue filled circles. At first sight, some structure can be inferred in the nebular emission surrounding our science targets. To better characterize this effect, we studied the variations of the Hα nebular emission with the sky fibers: we measured a mean full width at 10% of ~41 km s-1 with a standard deviation of ~3 km s-1. We computed a median sky fiber and corrected the science spectra with that median; therefore the dispersion measured in those fibers translated into an added ~7% uncertainty in our measurements.
The original accretion criterion provided in Barrado y Navascués & Martín (2003) shows the limiting EW(Hα) as a function of the spectral type. Since for most of the sources from Dolan & Mathieu (1999, 2001) and a fraction of those from Sacco et al. 2008 we do not have spectral type determination, we used the temperature scale derived in Paper I to translate the original criterion into a Teff vs. EW(Hα) relationship.
As mentioned in Sect. 4.1, from the total census of 172 spectroscopically confirmed members of C69, there are 16 sources for which we do not have a measurement of the equivalent width of Hα and therefore we cannot apply the criterion. Those 16 sources present very dispersed properties such as effective temperature, disk presence, etc; and therefore they should not produce any bias in the statistics derived for the whole cluster.
In Fig. 5 we show the accretion criterion applied to the 156 confirmed members with measurements of the EW(Hα). To be consistent we also translate objects with a spectral type determination into effective temperatures using the temperature scale from Paper I (as we did for the criterion itself). On the other hand, we assumed the Teff derived from the SED fit performed with VOSA (Bayo et al. 2008, 2012, submitted) for objects without spectral type determination, . Applying the saturation criterion, we classified 9 % of the members as accretors (14 red dots in the figure; see column “Acc” from Table 6).
To relate this percentage to the disk presence, in Fig. 5 we also included the information regarding the infrared class (as a proxy for the presence of a disk, from Barrado y Navascués et al. 2007 and Morales-Calderón et al., in prep.) with larger circumferences surrounding Class II sources and/or those with a MIR slope compatible with thick, thin or transition disks. If we only consider the 37 members showing sign of harboring disks and with available measurements of EW(Hα), we estimate that 38 % show active accretion according to the saturation criterion.
To focus now on the substellar population of C69; if we consider as substellar those sources with estimated masses lower than 0.1 M⊙ to take into account uncertainties in the mass determination, we find eight brown dwarfs harboring disks and three of them to be accreting according to the criterion. This leaves us with a fraction of 37.5 % of accretors among the disk-bearing BDs, very similar to that of the stellar population and comparable with the substellar one provided in Scholz et al. (2007) for the similar age cluster Upper Sco (31%, 4 our of 13 objects).
In Table 6, we present the measured EWs of the Hα line of the sources in the sample. We have estimated the mass accretion rate for those classified as accretors using the measured FW10%(Hα) and the following relationship derived by Natta et al. (2004)2:  (1)The accretion rates calculated in this manner are also listed in Table 6. We note that for DM006, classified as accretor, we did not have a measurement of the FW10% and therefore we could not estimate the accretion rate.
In Fig. 6 we show an accretion rate versus mass diagram where we compare the values estimated in this work and those provided in Sacco et al. (2008) also for C69; with those derived in Rigliaco et al. (2011) for the slightly younger cluster σ Orionis (~3 Myr according to their HR diagram).
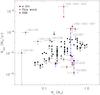 |
Fig. 6 Mass accretion rates versus mass of the central object for accreting objects. In red and blue we show members of C69 (red dots for measurements from this work and blue squares for those from Sacco et al. 2008, the masses of LOri061 and LOri063 have been slightly shifted so that in the figure the comparison between the measurements of two studies is clearer) and in black members of the slightly younger cluster σ Ori (measurements from Rigliaco et al. 2011). We included blue and red vertical bars to highlight special cases where more than one measurement is available for a given source (see Appendix A.2.2 for details). In all cases, the masses shown in this figure are the average between the one derived from the Lbol and the one derived from the Teff. The error bars display the differences among these determinations, see Paper I for details. Particular sources discussed in Appendix A.2.2 are highlighted with gray labels. |
Rigliaco et al. (2011) suggested in their work that there are two trends in this diagram with an inflection point at ~0.45 M⊙. The mass range in C69 for which we detected active accreting sources does not allow us to check this feature. Besides, the C69 sample is smaller and the dispersion of our measurements is much higher than that derived for σ Orionis by Rigliaco et al. (2011).
This high dispersion can arise at a first stage from the different methodology used to estimate the mass accretion rate. While Sacco et al. (2008) and this work use the Hα emission, “contaminated” by chromospheric activity as already discussed, Rigliaco et al. (2011) used U-band photometry; a “cleaner” methodology. On the other hand, C69 is likely older than σ Orionis and the accretion disks of the former may be in a different evolutionary state than those of the latter.
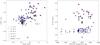 |
Fig. 7 Confirmed members with Hα in emission as compiled in Paper I. Left: IRAC color–color diagram including information about the nature of the disk and the Hα emission of the sources. Sources showing infrared excess have been surrounded by a black circumference. A blue square with a size proportional to the intensity of the Hα emission of the sources is also shown in the figure. Whenever no square is present, the EW of the line is lower than 5 Å. The class II area according to Allen et al. (2004) is highlighted with dashed lines. Right: effective temperature vs. IRAC SED slope of the confirmed and candidate members of C69 including information about the nature of the disk and the Hα emission of the sources as in the left panel. |
Overall, our measurements are consistent with the idea that the accretion rate scales with the mass of the central object for low-mass stars. But, given the dispersion obtained, this is just a very rough trend. Individual sources from Figs. 5 and 6 are analyzed in Appendix A.2.2.
Finally, to have a better understanding of the relation of the Hα emission with the accretion process, we have tried to correlate that emission with disk properties derived mainly from the mid-infrared photometry.
The theoretical disk models used to interpret the IRAC [3.6]–[4.5] vs. [5.8]–[8.0] color–color diagram by Allen et al. (2004) suggest that the accretion rates increase from the bottom-left to the top-right of the Class II region, due to the increase of both the disk emission and the wall emission. In Fig. 7 we show the mentioned IRAC color–color diagram for the members of C69 (spectroscopically confirmed members compilation from Paper I). We include information regarding the presence of disks (large black circles), the intensity of the emission of Hα (blue squares) and the classification as accretors (in red). The general trend agrees with the disk theory since objects with broader Hα equivalent widths (up to accreting sources) have redder colors. A similar trend can be observed in the right panel of the same figure where we display the mid-infrared SED slope as a function of effective temperature. Objects with optically thick disks seem to exhibit more intense Hα emission. On the other hand, as was already clear in Fig. 5, a large part of the sources (~65%) harboring disks in C69 do not seem to be accreting from their disks. We will analyze this fact in more detail in Sect. 4.4.
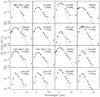 |
Fig. 8 SEDs of the sources classified as class II based on their IRAC colors and showing a sufficiently low EW(Hα) not to be classified as accretors according to Barrado y Navascués & Martín (2003). |
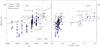 |
Fig. 9 Spectroscopically confirmed members from Paper I that lie in one of the two XMM-Newton pointings from Barrado et al. (2011) or in the central one from Franciosini & Sacco (2011). We show in different colors objects with mass below (in black) and above (in blue) 0.3 M⊙ (the completeness limit for Barrado et al. 2011). For the EW(Hα) measurements we have gathered data from Sacco et al. (2008), Dolan & Mathieu (1999) and this work. We have highlighted the sources detected in X-rays according to Barrado et al. (2011) and/or Franciosini & Sacco (2011) with large stars, and have joined with a gray solid line different measurements of EW(Hα) corresponding to the same source. Left: effective temperature vs. Hα equivalent width (positive for emission) along with the saturation criterion. Right: mid-infrared slope vs. Hα equivalent width (same convention as in the previous panel) |
4.4. Disk with low Hα. Binaries clearing the inner disks?
In the previous section we highlighted the presence of a large population of disk-bearing sources that do not show any sign of active accretion. In Fig. 8 we show examples of SEDs corresponding to this class of sources. We looked for some characteristic that would distinguish these objects from the others in our sample (other than the measured Hα equivalent width). Their effective temperatures are mainly colder than ~3750 K, but, as explained in the next section, that is characteristic of the entire disk population of C69.
One possibility for these “quiet” disks would be that they are dissipating their inner disks, but we see no difference in the near-infrared colors with respect to the actively accreting disks.
In addition, adopting the characterization of the α parameter from Lada et al. (2006), these objects harbor mainly optically thick disks (60% of them), but there are also sources with optically thin disks and the so-called transition/cold disks (Merín et al. 2010). There are several mechanisms to explain the evolutionary status of these transition disks; one of the most attractive, in the context of planet formation, is the clearing of the inner disk by a giant planet in its earliest stages of formation (see the first observational candidate for this scenario in Huélamo et al. 2011). Another possibility is tidal truncation in close binaries (Ireland & Kraus 2008). This seems to be the mechanism at work in at least one of the cases of the low Hα transition disks of C69; LOri043 that was classified as SB2 by Maxted et al. (2008). On the other hand, LOri043 is the only documented spectroscopic binary in this sample of quiet disks.
Finally, only two of the sources from this set have been detected in X-rays, suggesting that these are not particularly active objects either. In conclusion, we could not find any parameter (other than the Hα emission) that unites these objects or distinguishes them from the actively accreting population.
5. Disk vs. diskless populations
At the end of the previous section, we showed that we cannot trace differences between the actively accreting quiet-disk population of C69. In this section we analyze the clear distinction in terms of their X-ray emission and their mass functions between disk and diskless sources.
5.1. Hα and X-ray
As stated in Sect. 2, Barrado et al. (2011) presented the analysis of the XMM-Newton observations of two fields in C69. Several months later, Franciosini & Sacco (2011) complemented the study by adding an extra field that covers the vicinity of the massive star λ Ori, roughly at the center of the cluster.
These X-ray observations should trace the weak-line T Tauri (and substellar analogs) population of C69 well, therefore we have combined the data from the two studies and correlate it with our census of spectroscopically confirmed members.
In Fig. 9 we illustrate this advantage of the X-ray observations to unveil the weak-line T Tauri population. We show every member of C69 that lies in the field covered by the XMM-Newton observations. We have highlighted in blue objects above the completeness limit of 0.3 M⊙. We see that most of the sources classified as weak-line T Tauri, according to the saturation criterion, are detected in X-rays. We also show that the objects that are not detected in X-rays are preferentially those harboring optically thick disks (both active accretors and non-accreting sources). A total of 9 sources out of 12 with masses above 0.3 M⊙ that harbor disks and lie within the XMM-Newton fields of view are not detected in X-rays and are labeled in Fig. 9.
This dichotomy is shown even clearer in Fig. 10, where we show the X-ray luminosity vs bolometric luminosity ratio as a function of Hα equivalent width. Here, we see how most objects with EW(Hα) between ~5–20 Å that do not harbor disks are detected, while those showing infrared excess are not. We have highlighted five of the non-detected sources discussed in the previous paragraph for which Barrado et al. (2011) provide upper-limits of the X-ray luminosity. The remaining four non-detections are located toward the center of the cluster, within the field of view of the observations by Franciosini & Sacco (2011) and no upper-limit for the X-ray luminosity of the sources is provided in that work.
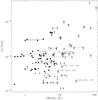 |
Fig. 10 EW(Hα) vs. LX/Lbol diagram for the members from Paper I in the area covered in X-rays by either Barrado et al. (2011) or Franciosini & Sacco (2011). As in previous figures, we use large open circles to highlight objects that show mid-infrared excess and red dots for those classified as accretors. Five-pointed stars indicate that the estimated mass of the object is larger than the critical mass 0.6 M⊙ explained in Sect. 5.2. |
5.2. Disk fractions
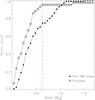 |
Fig. 11 Cumulative (normalized) mass functions for sources showing signs of harboring disks (infrared excess), plotted with large circles surrounding the points of the histogram, together with the cumulative mass function of sources detected by IRAC that show a photospheric MIR slope. The vertical red dashed line highlights the mass (~0.6 M⊙) at which the disk population is almost complete. |
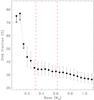 |
Fig. 12 Disk fraction as a function of the mass of the members of C69. For the ratio we used the same sets of objects as in the previous figure. |
If brown dwarfs were just a scaled-down version of stars, the disk life-times above and below the hydrogen burning limit should be the same. On the other hand, there is some evidence for longer life-times for infrared excesses in very low-mass stars and brown dwarfs than in higher-mass stars (Lada et al. 2006; Allers et al. 2007).
To test these possible differences, instead of estimating a typical star- and brown-dwarf disk fraction, we divided our census of confirmed members into two sets: sources showing some infrared excess, and objects detected also in the mid-infrared, that exhibit purely photospheric colors. The first set contains 43 sources and the second one 115. We propose this approach to avoid choosing a fixed frontier in mass between stars and brown dwarfs so that our findings are easier to compare with other studies. We considered in the same set all types of MIR slopes and shapes for the sources with excess: optically thick, optically thin and transition disks.
We computed the cumulative mass functions for both samples and the result is shown in Fig. 11: there is a clear difference at ~0.6 M⊙ (~M2 spectral type). While the mass function of the diskless population increases to ~1.1 M⊙, the disk population is almost completely composed of sources with masses lower than or equal to 0.6 M⊙. In other words: while we find diskless objects for every bin in mass, sources more massive than ~0.6 M⊙ seem to have lost their disks already. We tested the dependence of this change of behavior with the 5 Myr age assumed for C69 to estimate the masses. While an older age will significantly affect the mass determination of the lowest mass members of C69, this is not the case for sources with masses above 0.3 M⊙ according to the isochrones by Baraffe et al. (1998), Chabrier et al. (2000), and Allard et al. (2003), and therefore our result is robust against changes in the age determination of C69.
On the other hand, if we use these two cumulative fractions but without normalization to estimate the disk fraction as a function of the mass, we can see that the situation is more complex. In Fig. 12 and Table 5 we show the ratio of the two cumulative functions, that is, for a given mass Mi, we provide ni/Ni where ni is the total number of sources with mass ≤ Mi and infrared excess, and Ni is the total number of sources with mass ≤ Mi (ni plus the sources with purely photospheric infrared slopes and masses ≤ Mi). Because our sample is very large, we can derive standard Poisson uncertainty limits for masses larger than, or equal to, 0.3 M⊙ for the error treatment. For lower masses we used the approach described in Burgasser et al. (2003).
Even though the X-ray observations are only complete down to 0.3 M⊙ we are confident that this does not induce any bias in our analysis of the diskless population. The reason is that every source that in the spectroscopic confirmation turned out to be later than M3.5 and was detected in X-rays had previously already been selected as an optical photometric candidate. Therefore the optical photometric selection was as good as that performed with X-rays for detecting the low to very low mass members of C69.
The disk fraction function seems to peak (77%) at the brown dwarf boundary, dropping abruptly with increasing mass up to ~0.3 M⊙. It then stabilizes at ~33% before decreasing again for masses higher than ~0.6 M⊙. The total stellar disk fraction is 26 %.
%.
We must note that the extremely high disk fraction for substellar objects should be taken as an upper-limit. In this low-mass regime, we have some sources that have not been detected in the two reddest channels of Spitzer/IRAC (5.8 and 8.0 μm). We did not consider those sources since we only used sources with photospheric MIR SED to estimate the disk fractions. If we were certain that those sources do not show excess (and the fact that they are not detected at those red wavelengths is a good indicator of that), the percentage would decrease to ~58%
This fraction is still higher than that derived by Barrado y Navascués et al. (2007) for the same cluster (~40%). This is expected because in this study we consider the fraction with any type of disk and not only class II sources as in Barrado y Navascués et al. (2007). On the other hand, the difference with the value derived by Scholz et al. (2007) for Upper Sco (~37%), a similar age cluster, although it is significant, could just be caused by small number statistics or again, use of a different criterion to infer whether a source is harboring a disk or not.
Disk fraction as a function of mass.
5.3. Spatial distribution
In Fig. 13 we show the spatial distribution of C69 spectroscopically confirmed members (by Dolan & Mathieu 1999, 2001; Sacco et al. 2008; Maxted et al. 2008 or this work) including information about X-ray emission (from Barrado et al. 2011 and/or Franciosini & Sacco 2011), the presence of a disk (Barrado y Navascués et al. 2007) and whether the disk is accreting or not. As can be seen in the figure, the sources with a disk show a higher concentration towards the center of the cluster with respect to the diskless population (contrary to what one would expect according to the supernovae scenario and to what was previously suggested in Barrado y Navascués et al. 2007). Indeed, if we assume that actively accreting systems are younger than those which do not show any sign of accretion, the youngest population of C69 seems to be clustered either around the central star λ Ori or to the southwest.
We computed the two-sided Kuiper statistic (invariant Kolmogorov-Smirnov), and the associated probability that any of the previously mentioned populations were drawn from the same distribution. The tests reveal that the cumulative distribution function of class II candidates is very different from that of class III, with a 99.9% probability that both populations have been drawn from different distributions.
The conclusion from this test is that objects with masses lower than 0.6 M⊙ have been less efficient in loosing their circumstellar material in the lifetime of C69.
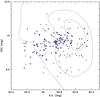 |
Fig. 13 Spatial distribution of the spectroscopically confirmed members of C69. Active accretors according to the saturation criterion are highlighted in red. Information regarding infrared excess (as a proxy for the presence of disk, from Barrado y Navascués et al. 2007) is provided by surrounding those sources with larger circumferences. The more massive population of C69 (λ Ori itself and the B stars) is shown with gray four-pointed stars. Finally, the members with X-ray detections are shown with five-pointed blue stars. |
6. Summary and conclusions
We have analyzed the spectroscopic properties of the very complete sample of members of C69 compiled in Bayo et al. (2011). Using different spectroscopic features, we tried to better understand the similarities and differences between populations with and without disks and the stellar and substellar ones. Our main results can be summarized as follows:
We have estimated the rotational velocities for eight members. We found a high dispersion in the vsin(i) values, which is higher among the diskless population. We interpret this as a result of disk locking in some of the C69 members.
We have studied the variability of the Hα emission line in 142 members classified as magnetically active (non-accreting sources). We also identified candidates that might have experienced flares during the epoch of observation.
We have tried to distinguish the activity and accretion contributions to the Hα emission. In this context, for those sources showing wide Hα equivalent widths (wider than is expected to arise from chromospheric activity), we derived accretion rates using mainly the full width at 10% of the flux of the Hα emission line (but also the Ca II IRT) obtaining a very broad spread of values. Once individual cases were analyzed, these spread values were still compatible with those previously reported in the literature for objects of similar mass and age (Rigliaco et al. 2011). When considering all confirmed members with Hα measurements, we estimate a 9% fraction of accretors in C69. If we only consider objects with disks, 38% show active accretion.
We have studied the relation Hα – disk properties. While the general trend expected from disk models applies, we also identified a substantial population of “quiet” disks. These are objects that show clear mid-infrared excess (with a variety of SED shapes) but Hα levels compatible with arising from pure chromospheric activity and not from the interaction with the disk via accretion.
We found a stellar disk fraction of 26% and can put some limits to the substellar disk fraction of 58% (for the faintest members, due to sensitivity limitations, the lack of detection at 5.8 and/or 8 micron does not imply the presence or absence of a substellar disk). These fractions are similar to (taking into account the difference in procedure followed to estimate the fraction) those previously provided for C69 itself by Barrado y Navascués et al. (2004b) (~40%) and is significantly higher than those derived by Scholz et al. (2007) for the cluster of similar age Upper Sco (~37%).
We estimate an accretion fraction for brown dwarfs in C69 between 30% and ~ 43% taking into account our uncertainties in mass determination. This accretion fraction is compatible with the one provided by Scholz et al. (2007) for the substellar population of Upper Sco.
We have confirmed that X-ray observations (Barrado et al. 2011; Franciosini & Sacco 2011) are extremely efficient in recovering the class III population of C69 in the intermediate- to low-mass range.
We have compared the mass function of the disk and diskless populations of C69, finding that 0.6 M⊙ seems to be the critical mass below which a significant fraction of the members preserve their disks. This result implies different disk lifetimes for different stellar masses. In particular, for masses lower than 0.6 M⊙ we showed that the disk fraction rises very steeply, with the caveat that in the brown-dwarf domain the fraction provided should be taken as an upper limit.
We have studied the spatial distribution of the disk-harboring population of C69 and found that, incontrast to what Dolan & Mathieu (2001) derived from their more massive member sample, the density of disk-sources is higher closer to the center of the cluster, which is inconsistent with the supernovae scenario invoked to explain the origin of the Lambda Orionis star-forming region. In addition, the winds (current or in the recent past) from the massive star λ Ori, do not seem to have affected the distribution of disk- and diskless cluster members.
Online material
Parameters and measurements obtained in this work for Collinder 69 confirmed members and comparison with previous studies.
Appendix A: Particular sources
In this appendix we provide a more detailed analysis for sources that show peculiarities in the properties studied in Sects. 3 and 4. For consistency we grouped the interesting sources from Sect. 4 following the same subsection scheme.
A.1. Rotational velocities
LOri075: this source has been classified as single-line spectroscopic binary (SB1) by Maxted et al. (2008) (but no binarity sign has been reported in Sacco et al. 2008). According to Maxted et al. (2008), the spectral lines for this star show rotational broadening; the authors compared them to those of a narrow-lined star of similar spectral type and estimated a projected rotational velocity of vsin(i) ~ 65 km s-1. They classified the source as SB1, but also noted that there is an asymmetry in the cross-correlation function (CCF) in the form of a blue-wing, particularly when the measured radial velocity corresponds to a redshift. Therefore they suggested that the fainter component in this binary was detected but unresolved in their spectra.
We detected a double-peaked structure in Hα and Li I in our Magellan/MIKE spectra that made us believe that we had spectroscopically resolved the source. While the origin of double-peak in Li I should be related to binarity, the Hα one could arise from an accreting companion, for example. Additional research on the structure of some photospheric lines marginally confirms this idea. In Fig. A.1 we show the double-peaked structure found in some of the most prominent photospheric lines for this object (given the low temperature of the source, these “most prominent lines” are still very weak). We measured a mean relative velocity of ~45 km s-1 (σ ~ 9 km s-1). We synthesized a 3500 K (log (g) = 4.0) Kurucz spectrum (an effective temperature ~100 K hotter than that estimated for our source, but the coolest temperature for the Kurucz collection) in the region of the Ba λ5535 Å line with the same resolution and a rotational velocity close to that derived by Maxted et al. (2008) (~50 km s-1). We checked that the closest line in the synthetic spectra has a relative velocity of ~110 km s-1, much higher than those measured by us. We show on the right-hand side panel of Fig. A.1 that the relative velocity derived for the photospheric lines does not agree with the one that would be measured from the Hα profile. This fact and the weakness of the lines measured force us to consider the resolution of the binary as tentative. We must note that the environmental Hα component (see Fig. 3) of the region or a possible accreting companion could change the relative velocity of the peaks of this emission line.
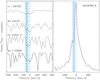 |
Fig. A.1 Left: double-peaked structure found in photospheric lines for LOri075. Restframe velocity and mean relative velocity of the second peak are indicated with dashed lines. The shaded (blue) rectangle shows the ± 3σ area of the second peak location. Right: Hα profile of the same source. Note how the secondary peak dashed line location (calculated from the photospheric lines) does not agree with the position of the peak (see text for details). |
A.2. Activity and accretion
A.2.1. Variability connected to activity
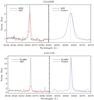 |
Fig. A.2 Comparisons of the Hα line profiles for different observations of the same two objects. Upper panel: LOri068; one of the objects we suspect esperienced a flare during the Keck/LRIS observations (R ~ 2700). Some asymmetry can be seen in the line even though the resolution of the spectrum is moderate. Lower panel: LOri109, another object suspected to have a flare for which no asymmetry in the line has been found. |
In our study of the Hα variable sources, we found a subset of five objects for which the criterion from Barrado y Navascués & Martín (2003) applied to spectra taken at different epochs provides contradictory results. While for some measurement of the object taken in one epoch (EW(Hα)1), the source would be classified as accretor, for a different epoch measurement of the same object (EW(Hα)2), the Hα emission could be explained purely in terms of activity.
-
LOri068 and LOri109 were observed twice during ourcampaigns and LOri068 was also observed by Saccoet al. (2008). Both objects areclassified as diskless sources based on their IRAC slopes, andwhile our Li I measurements agree among themselves (and forLOri068 that the one provided by Saccoet al. 2008), the Hα emission is much more intense in one spectrum for each source than in the others. We believe those spectra were taken while the objects were experiencing a flare. In Fig. A.2 we compare the line profiles of those objects in “steady” and “flared” states, and we show that while for LOri068 we can see some asymmetry in the line profile for the intense emission (which would indicate mass motion), this is not the case for LOri109 (even though for the latter the change in EW is much stronger).
-
LOri091 cannot be classified with certainty as a variable source. There is one measurement of Hα clearly different from the other two available, but that measurement corresponds to a TWIN spectrum of very poor S/N that translates into a large uncertainty on the continuum, and therefore a very large errorbar in the measurement.
-
LOri075 is an unresolved (or marginally resolved, see subsection A.1) double system, and therefore variability in the measured Hα is expected.
-
LOri080 is a puzzling case. We observed the object twice, in 2003 (at Las Campanas) and 2005 (at Calar Alto; see Paper I for a description of the instrumentation used in each case), and both measurements agree within the errors. These measurements place LOri080 at the border of being classified as accreting according to the saturation criterion (see next subsection), although the object shows no infrared excess in the IRAC data. No peculiarity has otherwise been found for the profiles of the lines in either spectra. On the other hand, Sacco et al. (2008) also observed LOri080 with FLAMES and found a significantly lower EW for Hα.
A.2.2. Hα emission as a proxy for accretion
In the process of determining the accretion fraction and their relation with the disk properties, we encountered several particular cases that we describe below.
LOri161: this is the brown dwarf from Fig. 5 that, even though its Hα emission places it well above the saturation criterion, has not been classified as harboring a disk according to its SED. The problem with this very faint source is that it was not detected in IRAC channels three and four (5.8 and 8.0 micron, respectively). Since the sensitivity of these channels is lower than that of one and two (3.6 and 4.5 micron), it could be that this object indeed has a disk that we are not sensitive to and that is undergoing accretion. In that scenario, the estimated accretion rate according to the FW10%(Hα) would be ~1 × 10⁻¹⁰ M⊙/yr, which is much lower than the accretion rate derived for LOri156 (~9.5 × 10⁻⁹ M⊙/yr), another brown dwarf with the same spectral type that we discuss below, but that harbors an optically thick disk.
An example of such a disk would be a transitional disk whose excess would be only detectable at longer wavelengths. We checked the new release of the WISE catalog (in the preliminary version the source is not detected) and found a counterpart within 1′′. Unfortunately, although the photometry at the longest wavelengths (~11 and 20 micron) shows a clear excess, these measurements have been classified as “U” (upper limit), and therefore we cannot confirm that this source does harbor a disk.
C69XE-009: an X-ray candidate from Barrado et al. (2011) confirmed spectroscopically as a C69 member in Paper I. This object is at the very limit of the saturation criterion; based on its SED it was classified as a candidate transition disk, but the linear fit to the mid-infrared slope is photospheric. Given that it is clearly an active object (detected in X-rays), and that the disk possibility is based on a very slight excess detected only in one infrared band, we assume that the Hα emission has its origin in chromospheric activity and not in accretion.
C69-IRAC-005: this is the source from Fig. 6 exhibiting the highest accretion rate based on the FW10%(Hα) (log (Ṁ) = −5.56 ± 0.25). The Spitzer/IRAC photometry suggests that it harbors an optically thick disk. This particular source was observed with CAFOS in low-resolution mode, with a wider wavelength coverage than that of the other instruments used (see Paper I). Thus, were able to obtain a different estimate for the accretion rate based on the equivalent width measurement of the components of the CaII triplet (at 8498 Å, 8542 Å and 8662 Å). This emission could be a sign of chromospheric activity too, as in the case of Hα, but the obtained equivalent widths for the triplet are too wide, placing our measurements in the broad-line component of the unresolved line structures that is generally related to accretion (see Comerón et al. 2003; Mohanty et al. 2005). Furthermore, as in Comerón et al. (2003), the CaII triplet line ratios are very close to 1:1:1 (quite different from the 1:9:5 expected ratio for optically thin emission).
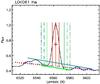 |
Fig. A.3 Detail of the Hα emission of LOri061 in the CAHA/TWIN spectrum. Note the dependence on the measurement of the full width at 10% of the flux with the pseudo-continuum choice, in particular for the light green and the teal cases (for a complete description of the process to determine the different continuums see Appendix A of Paper I). |
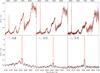 |
Fig. A.4 Upper panel: comparison of accreting (red, very low mass / BD LOri126 and brown dwarfs LOri140 and LOri156) and non-accreting (black, with the same spectral type) members with low-resolution spectra. Note the absence of veiling. Lower panel: detail of the Hα emission of the same comparison. |
We used the following equations to estimate the accretion rate from the CaII triplet (these equations were derived from the accretion line profile study by Muzerolle et al. 1998 and are discussed in more detail in Comerón et al. 2003): ![Mathematical equation: \appendix \setcounter{section}{1} \begin{eqnarray} &&\log(\dot{M}_{\rm acc}) = -34.15 + 0.89 \log(F_{\rm CaII(\lambda8542)}) \\[1mm] &&F_{\rm CaII(\lambda8542)}=4.72 \times 10^{33} EW({\rm CaII(\lambda8542)}) \nonumber\\ &&\;\qquad \quad\qquad \times 10^{-0.4(m_{\lambda}-0.54A_{V})}, \end{eqnarray}](/articles/aa/full_html/2012/11/aa19374-12/aa19374-12-eq81.png) \arraycolsep1.75ptwhere FCaII(λ8542) is the flux in the line, mλ is the magnitude of the star at λ8542, and AV is the visual extinction translated into the wavelength of the line of study using Fitzpatrick (1999) relations. Since the bluest photometric point available for this object is the 2MASS J magnitude, we used the best-fitting model to the SED of the source as a scaling factor to estimate mλ. On the other hand, according to the intrinsic colors by Leggett (1992) and our determination of the spectral type (M3), we found a very low AV value of 0.03 mag (much lower than the average value of 0.36 mag derived for the cluster by Duerr et al. 1982, but neither of them would significantly affect this estimation).
\arraycolsep1.75ptwhere FCaII(λ8542) is the flux in the line, mλ is the magnitude of the star at λ8542, and AV is the visual extinction translated into the wavelength of the line of study using Fitzpatrick (1999) relations. Since the bluest photometric point available for this object is the 2MASS J magnitude, we used the best-fitting model to the SED of the source as a scaling factor to estimate mλ. On the other hand, according to the intrinsic colors by Leggett (1992) and our determination of the spectral type (M3), we found a very low AV value of 0.03 mag (much lower than the average value of 0.36 mag derived for the cluster by Duerr et al. 1982, but neither of them would significantly affect this estimation).
We obtained an accretion rate value of ~3 × 10⁻⁷ M⊙/yr, almost an order of magnitude lower than the one obtained based on Hα, which gives us an idea of the caveats of estimating accretion rates from measurements that can be easily contaminated by activity or even by wind contributions.
On the other hand, even though the two estimates differ by such a large factor, this object still seems to be experiencing heavy accretion. We compared its spectrum with that of C69-IRAC-002 (another M3 star, observed with the same setup, harboring a disk but with Hα compatible with pure chromospheric activity and no CaII emission) looking for veiling emission, and no blue excess was found in the source (apart from a marginal excess direcly in the blue edge of the spectra that we think corresponds to an instrumental signature and not to a real excess). This result is not surprising since the wavelength coverage starts at 6200 Å, and veiling in young stars is normally detected at bluer wavelengths. Therefore, we need additional spectroscopic measurements to confirm the presence of veiling in this source.
LOri050, LOri061 and LOri063 are the other sources with more than one estimate of Ṁacc.
LOri050 is a spectroscopic binary according to Sacco et al. (2008) and Maxted et al. (2008); it has been classified as Class II according to its mid-infrared photometry and we obtained two spectra with different instrumentation (see Paper I for details). According to the Hα emission, the object is above the saturation criterion in both cases. The estimated accretion rates for both measurements agree well within the errors (log (Ṁ) = −11.09 ± 0.05, −10.91 ± 0.05). Therefore, we are observing a very interesting system with a total stellar mass of ~0.3 M⊙ and a circumbinary disk that is actively accreting.
For LOri063, on the other hand, the two available accretion rate estimates (from Sacco et al. 2008 and this work) differ by more than an order of magnitude (log (Ṁ) = −10.7 ± 0.3, − 11.87 ± 0.07). LOri063 harbors an optically thick disk according to its IRAC photometry, and the change in the full width at 10% of the flux in Hα is also reflected in the change in EW of the line (>9 Å).
Finally, our measurement of LOri061 does not agree at all with that from Sacco et al. (2008) (two orders of magnitude difference, log (Ṁ) = −10.2 ± 0.3, −7.65 ± 0.05). We believe this difference arises from how sensitive the measurement of the FW10%(Hα) is to the local continuum determination. In Fig. A.3 we illustrate the case graphically. While our automatic procedure (see Appendix A of Paper I for details) identifies a local continuum, the thick light green line, other routines fitting global continuum could base their measurements on the teal line. This difference in the determination of the “real base” of the line yields the large discrepancy in the estimated accretion rate. We must note in any case that among our data on accretors, we do not have other sources where the Hα profile can provoke this confusion in the continuum determination.
LOri126, LOri140 and LOri156 are the three brown dwarfs (LOri126 is directly at the limit between a BD and a very low mass star depending on the method used to estimate its mass, see Paper I) from Fig. 6 exhibiting very high accretion rates (log (Ṁ) = −8.78 ± 0.10, − 8.88 ± 0.14, − 8.02 ± 0.10, respectively). According to their mid-infrared slope, the three targets harbor optically thick disks. And according to their very large Hα equivalent widths, they are well above the saturation criterion.
With these high accretion rates some veiling (due to excess emission from the accretion shock) could be expected in these sources (as is the case for LS-RCrA 1, Barrado y Navascués et al. 2004a). To study this possibility, we selected a non-accreting class III source with very similar spectral type (one half subclass) for each brown dwarf and compared the strength of several TiO molecular bands in both spectra. As can be seen in Fig. A.4, no significant differences are found in the continuum level of any pair of sources. Indeed, in the three cases, rλ, defined as F(λ)excess/F(λ)photosphere is negligible. Whilst for LS-RCrA 1, Barrado y Navascués et al. (2004a) found that rλ varies from ~ 1 to ~ 0.25 for the wavelength range 6200–6750 Å, we found a horizontal slope in this interval. The only cases where a linear horizontal rλ does not work are located at the very edges of the detector, and therefore we can conclude that no veiling is detected in any of the spectra in the studied wavelength range (this does not imply that some veiling cannot be present at bluer wavelengths).
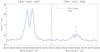 |
Fig. A.5 Double peaked structure in the Hα emission of C69-IRAC-007 and C69-IRAC-006. |
C69-IRAC-006 and C69-IRAC-007: both sources are classified as class II based on their IRAC photometry and show a double-peaked structure of the Hα emission, as can be seen in Fig. A.5. Whilst the sky subtraction for C69-IRAC-007 worked very well, some residual could remain for C69-IRAC-006 (although we see no structure on other, very narrow, “sky lines”).
This double peak is not present either in the other emission line detected in both spectra (He I) or in the absorption lines, which to a certain extent excludes the possibility that these sources are spectroscopic binaries (SB2). We do not have an estimate of the rotational velocities of either given the resolution of the VLT/FLAMES observations (R ~ 8000), but these almost symmetrical double-peak structures in Hα have been reproduced with models for higher mass stars with rapid rotation seen almost pole-on (see Muzerolle et al. 2003 and references therein).
The accretion rate calculated for C69-IRAC-007 is shown in Table 6 since this source fulfills the Barrado y Navascués & Martín (2003) criterion (log (Ṁ) = −7.05 ± 0.02). On the other hand, although the measured Hα equivalent width of C69-IRAC-006 lies well below the saturation criterion of Barrado y Navascués & Martín (2003), the wide FW10% measured (~190 km s-1) places this object very close to the limit of accretors according to Natta et al. 2004). In addition, note the resemblance of the Hα profile of C69-IRAC-006 with that of Cha Hα2, an accreting brown dwarf, modeled in detail (and showing peculiarities attributed to the presence of an outflow) in Natta et al. (2004).
IRAF is distributed by the National Optical Astronomy Observatory, which is operated by the Association of Universities for Research in Astronomy, Inc. under contract to the National Science Foundation.
The FW10%(Hα) of the sources are typically above the threshold of 200 km s-1 determined by Natta et al. (2004) and both quantities, accretion rates and FW10%(Hα), are provided in Table 6.
Acknowledgments
A. Bayo would like to thank B. Montesinos for the interesting discussion about the rotational velocity determination and H. Bouy and M. Lopez del Fresno for very useful advice in statistics. This publication makes use of VOSA, developed under the Spanish Virtual Observatory project supported from the Spanish MICINN through grant AYA2008-02156. This work was co-funded under the Marie Curie Actions of the European Commission (FP7-COFUND) and Spanish grants AYA2010-21161-C02-02, CDS2006-00070 and PRICIT-S2009/ESP-1496.
References
- Allard, F., Guillot, T., Ludwig, H.-G., et al. 2003, in Brown Dwarfs, ed. E. Martín, IAU Symp., 211, 325 [Google Scholar]
- Allen, L. E., Calvet, N., D’Alessio, P., et al. 2004, ApJS, 154, 363 [NASA ADS] [CrossRef] [Google Scholar]
- Allers, K. N., Jaffe, D. T., Luhman, K. L., et al. 2007, ApJ, 657, 511 [NASA ADS] [CrossRef] [Google Scholar]
- Baraffe, I., Chabrier, G., Allard, F., & Hauschildt, P. 1998, VizieR Online Data Catalog: J/A+A/337/403 [Google Scholar]
- Barrado, D., Stelzer, B., Morales-Calderón, M., et al. 2011, A&A, 526, A21 [NASA ADS] [CrossRef] [EDP Sciences] [Google Scholar]
- Barrado y Navascués, D., & Martín, E. L. 2003, AJ, 126, 2997 [NASA ADS] [CrossRef] [Google Scholar]
- Barrado y Navascués, D., García López, R. J., Severino, G., & Gomez, M. T. 2001, A&A, 371, 652 [NASA ADS] [CrossRef] [EDP Sciences] [Google Scholar]
- Barrado y Navascués, D., Zapatero Osorio, M. R., Martín, E. L., et al. 2002, A&A, 393, L85 [NASA ADS] [CrossRef] [EDP Sciences] [Google Scholar]
- Barrado y Navascués, D., Béjar, V. J. S., Mundt, R., et al. 2003, A&A, 404, 171 [NASA ADS] [CrossRef] [EDP Sciences] [Google Scholar]
- Barrado y Navascués, D., Mohanty, S., & Jayawardhana, R. 2004a, ApJ, 604, 284 [NASA ADS] [CrossRef] [Google Scholar]
- Barrado y Navascués, D., Stauffer, J. R., Bouvier, J., Jayawardhana, R., & Cuillandre, J.-C. 2004b, ApJ, 610, 1064 [NASA ADS] [CrossRef] [Google Scholar]
- Barrado y Navascués, D., Stauffer, J. R., Morales-Calderón, M., et al. 2007, ApJ, 664, 481 [NASA ADS] [CrossRef] [Google Scholar]
- Bayo, A. 2009, Ph.D. Thesis, Universidad Autónoma de Madrid [Google Scholar]
- Bayo, A., Rodrigo, C., Barrado Y Navascués, D., et al. 2008, A&A, 492, 277 [NASA ADS] [CrossRef] [EDP Sciences] [Google Scholar]
- Bayo, A., Barrado, D., Stauffer, J., et al. 2011, A&A, 536, A63 [NASA ADS] [CrossRef] [EDP Sciences] [Google Scholar]
- Bouvier, J., Forestini, M., & Allain, S. 1997, A&A, 326, 1023 [NASA ADS] [Google Scholar]
- Burgasser, A. J., Kirkpatrick, J. D., Reid, I. N., et al. 2003, ApJ, 586, 512 [NASA ADS] [CrossRef] [Google Scholar]
- Castelli, F., Gratton, R. G., & Kurucz, R. L. 1997, A&A, 318, 841 [NASA ADS] [Google Scholar]
- Chabrier, G., Baraffe, I., Allard, F., & Hauschildt, P. 2000, ApJ, 542, 464 [NASA ADS] [CrossRef] [Google Scholar]
- Comerón, F., Fernández, M., Baraffe, I., Neuhäuser, R., & Kaas, A. A. 2003, A&A, 406, 1001 [NASA ADS] [CrossRef] [EDP Sciences] [Google Scholar]
- Dolan, C. J., & Mathieu, R. D. 1999, AJ, 118, 2409 [NASA ADS] [CrossRef] [Google Scholar]
- Dolan, C. J., & Mathieu, R. D. 2001, AJ, 121, 2124 [NASA ADS] [CrossRef] [Google Scholar]
- Duerr, R., Imhoff, C. L., & Lada, C. J. 1982, ApJ, 261, 135 [NASA ADS] [CrossRef] [Google Scholar]
- Fernández, M., Stelzer, B., Henden, A., et al. 2004, A&A, 427, 263 [NASA ADS] [CrossRef] [EDP Sciences] [Google Scholar]
- Finkbeiner, D. P. 2003, ApJS, 146, 407 [NASA ADS] [CrossRef] [Google Scholar]
- Fitzpatrick, E. L. 1999, PASP, 111, 63 [NASA ADS] [CrossRef] [Google Scholar]
- Franciosini, E., & Sacco, G. G. 2011, A&A, 530, A150 [NASA ADS] [CrossRef] [EDP Sciences] [Google Scholar]
- Hartmann, L. 1999, Phys. Today, 52, 60 [CrossRef] [Google Scholar]
- Hartmann, L., Hewett, R., & Calvet, N. 1994, ApJ, 426, 669 [NASA ADS] [CrossRef] [Google Scholar]
- Hauschildt, P. H., Allard, F., & Baron, E. 1999, ApJ, 512, 377 [NASA ADS] [CrossRef] [Google Scholar]
- Huélamo, N., Lacour, S., Tuthill, P., et al. 2011, A&A, 528, L7 [NASA ADS] [CrossRef] [EDP Sciences] [Google Scholar]
- Ireland, M. J., & Kraus, A. L. 2008, ApJ, 678, L59 [NASA ADS] [CrossRef] [Google Scholar]
- Jayawardhana, R., Luhman, K. L., D’Alessio, P., & Stauffer, J. R. 2002a, ApJ, 571, L51 [NASA ADS] [CrossRef] [Google Scholar]
- Jayawardhana, R., Mohanty, S., & Basri, G. 2002b, ApJ, 578, L141 [NASA ADS] [CrossRef] [Google Scholar]
- Jayawardhana, R., Ardila, D. R., Stelzer, B., & Haisch, Jr., K. E. 2003a, AJ, 126, 1515 [NASA ADS] [CrossRef] [Google Scholar]
- Jayawardhana, R., Mohanty, S., & Basri, G. 2003b, ApJ, 592, 282 [NASA ADS] [CrossRef] [Google Scholar]
- Lada, C. J., Muench, A. A., Luhman, K. L., et al. 2006, AJ, 131, 1574 [NASA ADS] [CrossRef] [Google Scholar]
- Leggett, S. K. 1992, ApJS, 82, 351 [NASA ADS] [CrossRef] [Google Scholar]
- Martín, E. L., Dougados, C., Magnier, E., et al. 2001, ApJ, 561, L195 [NASA ADS] [CrossRef] [Google Scholar]
- Maxted, P. F. L., Jeffries, R. D., Oliveira, J. M., Naylor, T., & Jackson, R. J. 2008, MNRAS, 385, 2210 [NASA ADS] [CrossRef] [Google Scholar]
- Merín, B., Brown, J. M., Oliveira, I., et al. 2010, ApJ, 718, 1200 [NASA ADS] [CrossRef] [Google Scholar]
- Mohanty, S., & Basri, G. 2003, ApJ, 583, 451 [NASA ADS] [CrossRef] [Google Scholar]
- Mohanty, S., Jayawardhana, R., & Barrado y Navascués, D. 2003, ApJ, 593, L109 [NASA ADS] [CrossRef] [Google Scholar]
- Mohanty, S., Jayawardhana, R., & Basri, G. 2005, ApJ, 626, 498 [NASA ADS] [CrossRef] [Google Scholar]
- Morales-Calderón, M. 2008, Ph.D. Thesis, Universidad Autónoma de Madrid [Google Scholar]
- Murdin, P., & Penston, M. V. 1977, MNRAS, 181, 657 [NASA ADS] [CrossRef] [Google Scholar]
- Muzerolle, J., Hartmann, L., & Calvet, N. 1998, AJ, 116, 455 [NASA ADS] [CrossRef] [Google Scholar]
- Muzerolle, J., Hillenbrand, L., Calvet, N., Briceño, C., & Hartmann, L. 2003, ApJ, 592, 266 [NASA ADS] [CrossRef] [Google Scholar]
- Natta, A., & Testi, L. 2001, A&A, 376, L22 [NASA ADS] [CrossRef] [EDP Sciences] [Google Scholar]
- Natta, A., Testi, L., Comerón, F., et al. 2002, A&A, 393, 597 [NASA ADS] [CrossRef] [EDP Sciences] [Google Scholar]
- Natta, A., Testi, L., Muzerolle, J., et al. 2004, A&A, 424, 603 [NASA ADS] [CrossRef] [EDP Sciences] [Google Scholar]
- Rigliaco, E., Natta, A., Randich, S., Testi, L., & Biazzo, K. 2011, A&A, 525, A47 [NASA ADS] [CrossRef] [EDP Sciences] [Google Scholar]
- Sacco, G. G., Franciosini, E., Randich, S., & Pallavicini, R. 2008, A&A, 488, 167 [NASA ADS] [CrossRef] [EDP Sciences] [Google Scholar]
- Scholz, A., Jayawardhana, R., Wood, K., et al. 2007, ApJ, 660, 1517 [NASA ADS] [CrossRef] [Google Scholar]
- Shu, F. H., Najita, J., Ruden, S. P., & Lizano, S. 1994, ApJ, 429, 797 [NASA ADS] [CrossRef] [Google Scholar]
- Soderblom, D. R., Stauffer, J. R., Hudon, J. D., & Jones, B. F. 1993, ApJS, 85, 315 [NASA ADS] [CrossRef] [Google Scholar]
- Stauffer, J. R., Hartmann, L. W., Prosser, C. F., et al. 1997, ApJ, 479, 776 [NASA ADS] [CrossRef] [Google Scholar]
- Testi, L., Natta, A., Oliva, E., et al. 2002, ApJ, 571, L155 [NASA ADS] [CrossRef] [Google Scholar]
- White, R. J., & Basri, G. 2003, ApJ, 582, 1109 [NASA ADS] [CrossRef] [Google Scholar]
All Tables
Teff, log (g) and rotational velocities derived by comparison with models for the sample of sources observed with Magellan/MIKE.
Equivalent width (negative for emission, positive for absorption) of the main lines observed in the spectra obtained with Magellan/MIKE and Keck/LRIS in its low- and high-resolution modes (the three different setups are separated by a double line).
Equivalent width of the main lines observed in the spectra obtained with VLT/FLAMES.
Parameters measured and calculated for those sources showing variations in Hα and no significant variability in alkali lines; or variations in Hα that causes them to oscillate between accreting and non-accreting (see text for details).
Parameters and measurements obtained in this work for Collinder 69 confirmed members and comparison with previous studies.
All Figures
|
Fig. 1 Example of vsin(i) estimation for LOri031. In black we plotted the science spectrum and on top of it with different colors the Kurucz model synthesized for 3750 K, log (g) of 4.0 and five different velocities. The synthetic spectra were produced with the same resolution as the observed one. |
| In the text | |
|
Fig. 2 Spectral type vs. vsin(i) for confirmed members of C69 from this work and Sacco et al. (2008) (black dots). For comparison, we include the old-disk population brown dwarfs from Mohanty & Basri (2003) with five pointed star symbols. From the C69 members we highlighted those exhibiting peculiarities: large open squares surround spectroscopic binaries, large open circles represent objects with infrared excess (assumed to be a signpost of the presence of a disk) and red dots were plotted on top of those objects classified as accretors according to the saturation criterion by Barrado y Navascués & Martín (2003) (see text for details). Finally, LOri075 is highlighted with a label and is discussed in Appendix A.1 |
| In the text | |
|
Fig. 3 Contours corresponding to a Hα image of C69 (extracted from the Hα six arcmin resolution all sky survey compiled by Finkbeiner 2003). We plotted the location of the C69 members using different symbols (all of them in black, see legend of the figure) according to the instrument with which the individual spectrum was obtained. As can be seen, a significant fraction of the sources have been observed more than once by us. The locations of sky fibers in the VLT/FLAMES campaign are displayed as blue filled dots and the position of Lambda Orionis (roughly marking the center of the cluster) is highlighted with a large blue five-pointed star. |
| In the text | |
|
Fig. 4 Hα profile of LOri073 observe at high resolution in two different epochs: with VLT/FLAMES (in red, R ~ 8600) in Jan 2008 and with Magellan/MIKE (in black, R ~ 11 250) in Dec 2002. |
| In the text | |
|
Fig. 5 Hα equivalent width versus the effective temperature for confirmed members of C69. We display data from Dolan & Mathieu (1999, 2001) with filled squares, and from Sacco et al. (2008) with filled diamonds. Our data are displayed with solid circles. In every sample, red symbols are used for the sources classified as accretors. Overlapping large circles highlight sources exhibiting excess in the Spitzer/IRAC photometry. For some sources we had more than one epoch of data (either ours or from Dolan & Mathieu 1999, 2001; Sacco et al. 2008). These different measurements for individual objects appear joined with a solid line. The short-dashed line corresponds to the saturation criterion defined by Barrado y Navascués & Martín (2003). A vertical dotted line highlights the substellar frontier for an estimated age of 5 Myr according to the isochrones from the Lyon group. Particular sources discussed in Appendix A.2.2 are highlighted with gray labels. |
| In the text | |
|
Fig. 6 Mass accretion rates versus mass of the central object for accreting objects. In red and blue we show members of C69 (red dots for measurements from this work and blue squares for those from Sacco et al. 2008, the masses of LOri061 and LOri063 have been slightly shifted so that in the figure the comparison between the measurements of two studies is clearer) and in black members of the slightly younger cluster σ Ori (measurements from Rigliaco et al. 2011). We included blue and red vertical bars to highlight special cases where more than one measurement is available for a given source (see Appendix A.2.2 for details). In all cases, the masses shown in this figure are the average between the one derived from the Lbol and the one derived from the Teff. The error bars display the differences among these determinations, see Paper I for details. Particular sources discussed in Appendix A.2.2 are highlighted with gray labels. |
| In the text | |
|
Fig. 7 Confirmed members with Hα in emission as compiled in Paper I. Left: IRAC color–color diagram including information about the nature of the disk and the Hα emission of the sources. Sources showing infrared excess have been surrounded by a black circumference. A blue square with a size proportional to the intensity of the Hα emission of the sources is also shown in the figure. Whenever no square is present, the EW of the line is lower than 5 Å. The class II area according to Allen et al. (2004) is highlighted with dashed lines. Right: effective temperature vs. IRAC SED slope of the confirmed and candidate members of C69 including information about the nature of the disk and the Hα emission of the sources as in the left panel. |
| In the text | |
|
Fig. 8 SEDs of the sources classified as class II based on their IRAC colors and showing a sufficiently low EW(Hα) not to be classified as accretors according to Barrado y Navascués & Martín (2003). |
| In the text | |
|
Fig. 9 Spectroscopically confirmed members from Paper I that lie in one of the two XMM-Newton pointings from Barrado et al. (2011) or in the central one from Franciosini & Sacco (2011). We show in different colors objects with mass below (in black) and above (in blue) 0.3 M⊙ (the completeness limit for Barrado et al. 2011). For the EW(Hα) measurements we have gathered data from Sacco et al. (2008), Dolan & Mathieu (1999) and this work. We have highlighted the sources detected in X-rays according to Barrado et al. (2011) and/or Franciosini & Sacco (2011) with large stars, and have joined with a gray solid line different measurements of EW(Hα) corresponding to the same source. Left: effective temperature vs. Hα equivalent width (positive for emission) along with the saturation criterion. Right: mid-infrared slope vs. Hα equivalent width (same convention as in the previous panel) |
| In the text | |
|
Fig. 10 EW(Hα) vs. LX/Lbol diagram for the members from Paper I in the area covered in X-rays by either Barrado et al. (2011) or Franciosini & Sacco (2011). As in previous figures, we use large open circles to highlight objects that show mid-infrared excess and red dots for those classified as accretors. Five-pointed stars indicate that the estimated mass of the object is larger than the critical mass 0.6 M⊙ explained in Sect. 5.2. |
| In the text | |
|
Fig. 11 Cumulative (normalized) mass functions for sources showing signs of harboring disks (infrared excess), plotted with large circles surrounding the points of the histogram, together with the cumulative mass function of sources detected by IRAC that show a photospheric MIR slope. The vertical red dashed line highlights the mass (~0.6 M⊙) at which the disk population is almost complete. |
| In the text | |
|
Fig. 12 Disk fraction as a function of the mass of the members of C69. For the ratio we used the same sets of objects as in the previous figure. |
| In the text | |
|
Fig. 13 Spatial distribution of the spectroscopically confirmed members of C69. Active accretors according to the saturation criterion are highlighted in red. Information regarding infrared excess (as a proxy for the presence of disk, from Barrado y Navascués et al. 2007) is provided by surrounding those sources with larger circumferences. The more massive population of C69 (λ Ori itself and the B stars) is shown with gray four-pointed stars. Finally, the members with X-ray detections are shown with five-pointed blue stars. |
| In the text | |
|
Fig. A.1 Left: double-peaked structure found in photospheric lines for LOri075. Restframe velocity and mean relative velocity of the second peak are indicated with dashed lines. The shaded (blue) rectangle shows the ± 3σ area of the second peak location. Right: Hα profile of the same source. Note how the secondary peak dashed line location (calculated from the photospheric lines) does not agree with the position of the peak (see text for details). |
| In the text | |
|
Fig. A.2 Comparisons of the Hα line profiles for different observations of the same two objects. Upper panel: LOri068; one of the objects we suspect esperienced a flare during the Keck/LRIS observations (R ~ 2700). Some asymmetry can be seen in the line even though the resolution of the spectrum is moderate. Lower panel: LOri109, another object suspected to have a flare for which no asymmetry in the line has been found. |
| In the text | |
|
Fig. A.3 Detail of the Hα emission of LOri061 in the CAHA/TWIN spectrum. Note the dependence on the measurement of the full width at 10% of the flux with the pseudo-continuum choice, in particular for the light green and the teal cases (for a complete description of the process to determine the different continuums see Appendix A of Paper I). |
| In the text | |
|
Fig. A.4 Upper panel: comparison of accreting (red, very low mass / BD LOri126 and brown dwarfs LOri140 and LOri156) and non-accreting (black, with the same spectral type) members with low-resolution spectra. Note the absence of veiling. Lower panel: detail of the Hα emission of the same comparison. |
| In the text | |
|
Fig. A.5 Double peaked structure in the Hα emission of C69-IRAC-007 and C69-IRAC-006. |
| In the text | |
Current usage metrics show cumulative count of Article Views (full-text article views including HTML views, PDF and ePub downloads, according to the available data) and Abstracts Views on Vision4Press platform.
Data correspond to usage on the plateform after 2015. The current usage metrics is available 48-96 hours after online publication and is updated daily on week days.
Initial download of the metrics may take a while.