Fig. 3
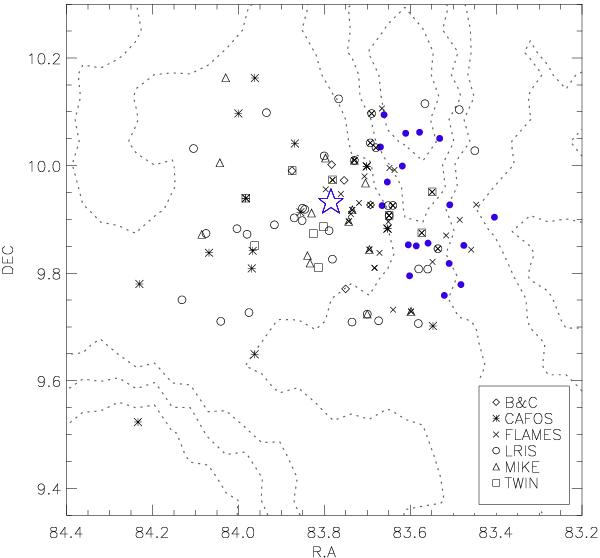
Contours corresponding to a Hα image of C69 (extracted from the Hα six arcmin resolution all sky survey compiled by Finkbeiner 2003). We plotted the location of the C69 members using different symbols (all of them in black, see legend of the figure) according to the instrument with which the individual spectrum was obtained. As can be seen, a significant fraction of the sources have been observed more than once by us. The locations of sky fibers in the VLT/FLAMES campaign are displayed as blue filled dots and the position of Lambda Orionis (roughly marking the center of the cluster) is highlighted with a large blue five-pointed star.
Current usage metrics show cumulative count of Article Views (full-text article views including HTML views, PDF and ePub downloads, according to the available data) and Abstracts Views on Vision4Press platform.
Data correspond to usage on the plateform after 2015. The current usage metrics is available 48-96 hours after online publication and is updated daily on week days.
Initial download of the metrics may take a while.