Fig. 11
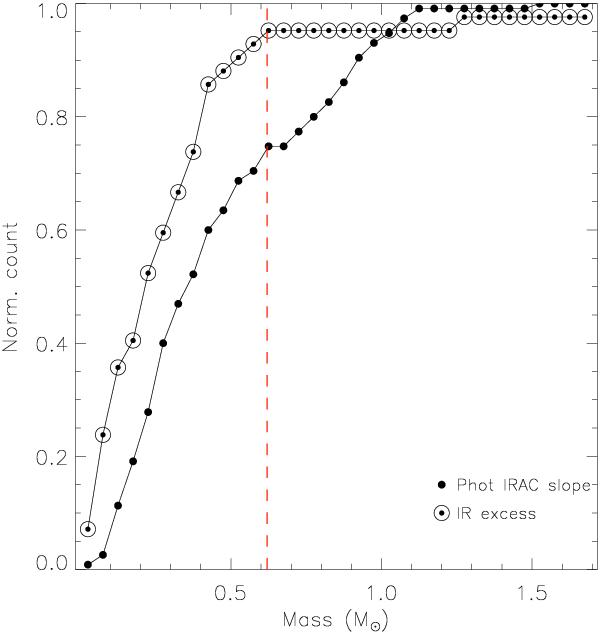
Cumulative (normalized) mass functions for sources showing signs of harboring disks (infrared excess), plotted with large circles surrounding the points of the histogram, together with the cumulative mass function of sources detected by IRAC that show a photospheric MIR slope. The vertical red dashed line highlights the mass (~0.6 M⊙) at which the disk population is almost complete.
Current usage metrics show cumulative count of Article Views (full-text article views including HTML views, PDF and ePub downloads, according to the available data) and Abstracts Views on Vision4Press platform.
Data correspond to usage on the plateform after 2015. The current usage metrics is available 48-96 hours after online publication and is updated daily on week days.
Initial download of the metrics may take a while.