Fig. A.1
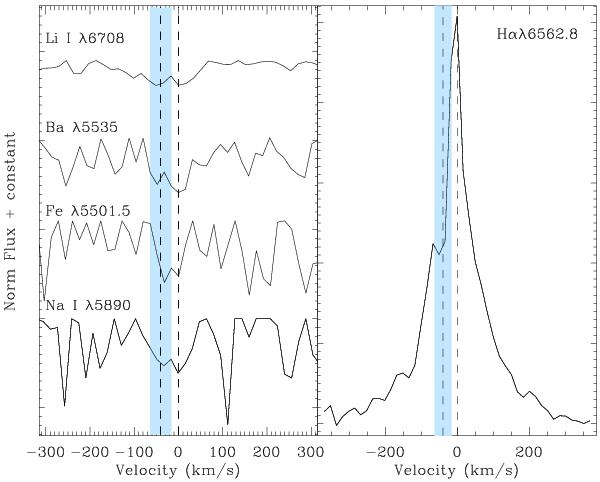
Left: double-peaked structure found in photospheric lines for LOri075. Restframe velocity and mean relative velocity of the second peak are indicated with dashed lines. The shaded (blue) rectangle shows the ± 3σ area of the second peak location. Right: Hα profile of the same source. Note how the secondary peak dashed line location (calculated from the photospheric lines) does not agree with the position of the peak (see text for details).
Current usage metrics show cumulative count of Article Views (full-text article views including HTML views, PDF and ePub downloads, according to the available data) and Abstracts Views on Vision4Press platform.
Data correspond to usage on the plateform after 2015. The current usage metrics is available 48-96 hours after online publication and is updated daily on week days.
Initial download of the metrics may take a while.