Fig. 10
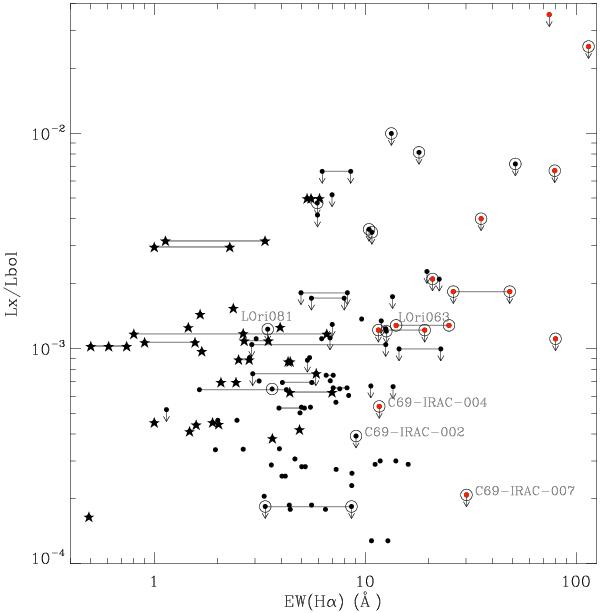
EW(Hα) vs. LX/Lbol diagram for the members from Paper I in the area covered in X-rays by either Barrado et al. (2011) or Franciosini & Sacco (2011). As in previous figures, we use large open circles to highlight objects that show mid-infrared excess and red dots for those classified as accretors. Five-pointed stars indicate that the estimated mass of the object is larger than the critical mass 0.6 M⊙ explained in Sect. 5.2.
Current usage metrics show cumulative count of Article Views (full-text article views including HTML views, PDF and ePub downloads, according to the available data) and Abstracts Views on Vision4Press platform.
Data correspond to usage on the plateform after 2015. The current usage metrics is available 48-96 hours after online publication and is updated daily on week days.
Initial download of the metrics may take a while.