Fig. 6
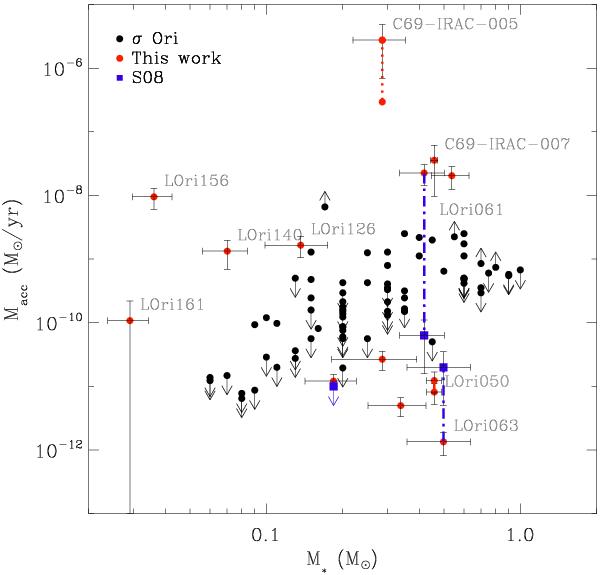
Mass accretion rates versus mass of the central object for accreting objects. In red and blue we show members of C69 (red dots for measurements from this work and blue squares for those from Sacco et al. 2008, the masses of LOri061 and LOri063 have been slightly shifted so that in the figure the comparison between the measurements of two studies is clearer) and in black members of the slightly younger cluster σ Ori (measurements from Rigliaco et al. 2011). We included blue and red vertical bars to highlight special cases where more than one measurement is available for a given source (see Appendix A.2.2 for details). In all cases, the masses shown in this figure are the average between the one derived from the Lbol and the one derived from the Teff. The error bars display the differences among these determinations, see Paper I for details. Particular sources discussed in Appendix A.2.2 are highlighted with gray labels.
Current usage metrics show cumulative count of Article Views (full-text article views including HTML views, PDF and ePub downloads, according to the available data) and Abstracts Views on Vision4Press platform.
Data correspond to usage on the plateform after 2015. The current usage metrics is available 48-96 hours after online publication and is updated daily on week days.
Initial download of the metrics may take a while.