Fig. 7
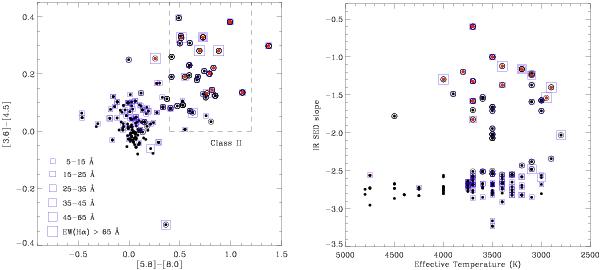
Confirmed members with Hα in emission as compiled in Paper I. Left: IRAC color–color diagram including information about the nature of the disk and the Hα emission of the sources. Sources showing infrared excess have been surrounded by a black circumference. A blue square with a size proportional to the intensity of the Hα emission of the sources is also shown in the figure. Whenever no square is present, the EW of the line is lower than 5 Å. The class II area according to Allen et al. (2004) is highlighted with dashed lines. Right: effective temperature vs. IRAC SED slope of the confirmed and candidate members of C69 including information about the nature of the disk and the Hα emission of the sources as in the left panel.
Current usage metrics show cumulative count of Article Views (full-text article views including HTML views, PDF and ePub downloads, according to the available data) and Abstracts Views on Vision4Press platform.
Data correspond to usage on the plateform after 2015. The current usage metrics is available 48-96 hours after online publication and is updated daily on week days.
Initial download of the metrics may take a while.