| Issue |
A&A
Volume 542, June 2012
|
|
|---|---|---|
| Article Number | A73 | |
| Number of page(s) | 13 | |
| Section | Planets and planetary systems | |
| DOI | https://doi.org/10.1051/0004-6361/201219001 | |
| Published online | 08 June 2012 | |
Interferometric mapping of the 3.3-mm continuum emission of comet 17P/Holmes after its 2007 outburst⋆,⋆⋆
1
Istituto di Radioastronomia, INAF, via Gobetti,
101
Bologna,
Italy
e-amil: This email address is being protected from spambots. You need JavaScript enabled to view it.
2
ESO, Karl Schwarzschild St. 2, 85748 Garching,
Muenchen,
Germany
3
LESIA, Observatoire de Paris, CNRS, UPMC, Université
Paris-Diderot, 5 place Jules
Janssen, 92195
Meudon,
France
Received: 9 February 2012
Accepted: 12 April 2012
Abstract
Context. Comet 17P/Holmes underwent a dramatic outburst in October 2007, caused by the sudden fragmentation of its nucleus and the production of a large quantity of grains scattering sunlight.
Aims. We report on 90 GHz continuum observations carried out with the IRAM Plateau de Bure interferometer on 27.1 and 28.2 October 2007 UT, i.e., 4−5 days after the outburst. These observations probed the thermal radiation of large dust particles, and therefore provide the best constraints on the mass in the ejecta debris.
Methods. The thermal emission of the debris was modelled and coupled to a time-dependent description of their expansion after the outburst. The analysis was performed in the Fourier plane. Visibilities were computed for the two observing dates and compared to the data to measure their velocity and mass. Optical data and 250-GHz continuum measurements published in the literature were used to further constrain the dust kinematics and size distribution.
Results. Two distinct dust components in terms of kinematic properties are identified in the data. The large-velocity component, with typical velocities V0 of 50−100 m s-1 for 1 mm particles, displays a steep size distribution with a size index estimated to q = −3.7 (±0.1), assuming a minimum grain size of 0.1 μm. It corresponds to the fast expanding shell observed in optical images. The slowly-moving “core” component (V0 = 7−9 m s-1) detected near the nucleus has a size index |q| < 3.4 and contains a higher proportion of large particles than the shell. The dust mass in the core is in the range 0.1−1 that of the shell. Using optical constants pertaining to porous grains (50% porosity) made of astronomical silicates mixed with water ice (48% in mass), the total dust mass Mdust injected by the outburst is estimated to 4−14 × 1011 kg, corresponding to 3−9% the nucleus mass.
Key words: techniques: interferometric / comets: individual: 17P/Holmes / radio continuum: planetary systems
Based on observations carried out with the IRAM Plateau de Bure Interferometer. IRAM is supported by INSU/CNRS (France), MPG (Germany) and IGN (Spain).
Table 5 is available in electronic form at http://www.aanda.org
© ESO, 2012
1. Introduction
Comet 17P/Holmes is a periodic comet of the Jupiter family that orbits the Sun with a period P = 6.9 years. It passed perihelion on 4 May 2007 at 2.05 AU from the Sun. On 24 October 2007, at 2.44 AU from the Sun and 1.63 AU from the Earth, the comet suddenly increased in brightness from a total visual magnitude mv ~ 17 to 2.5 to become a naked-eye object for months (Green 2007; Sekanina 2009). Comet 17P/Holmes underwent a similar outburst shortly before 6 November 1892, at the time of its discovery, followed by a similar event on 16 January 1893 (see the review of Sekanina 2009). After these events, the comet appearance at large scales was a bubble-like shape quickly expanding into interplanetary space (e.g., Montalto et al. 2008; Hsieh et al. 2010). The onset of the 2007 outburst occurred probably near 23.3 October UT (Hsieh et al. 2010) with the peak of optical brightening observed around 25.0 October UT (e.g., Li et al. 2011). These outbursts were likely caused by a sudden fragmentation of the nucleus, followed by the production of a large quantity of grains scattering sunlight. Determining the amount of material that split off from the nucleus and the size distribution of the particle debris in the cloud of dust ejecta is important to constrain the origin of the fragmentation process. Though sizeable individual fragments radiating outwards were possibly observed (Gaillard et al. 2007; Stevenson et al. 2010), the huge cross-sectional area of dust scattering sunlight suggests that the dust in the comet Holmes 2007 outburst was dominated by small particles.
Observation log and flux measurements.
The potential of millimetre and submillimetre-wavelength continuum observations for the study of cometary dust has been demonstrated (e.g., Jewitt & Luu 1990, 1992; Jewitt & Matthews 1999; Altenhoff et al. 1999; Bockelée-Morvan et al. 2010b). Such observations probe the thermal radiation of millimetre-sized dust particles, and therefore usefully complement optical and infrared observations, that are sensitive to micrometric particles. By measuring the radiation from large particles, they are of high value to measure dust masses. Constraints on the dust properties, e.g., the size distribution, can be obtained if measurements of the spectral index of the dust emission are available (Jewitt & Luu 1990, 1992).
Single-dish continuum measurements at 1.1 mm wavelength of comet 17P/Holmes obtained with the 30-m telescope of the Institut de Radioastronomie millimétrique (IRAM) have been presented by Altenhoff et al. (2009). A short report of observations at 1.3 and 0.8 mm conducted with the Submillimeter Array was given by Qi et al. (2010). In this paper, we present interferometric continuum observations performed at 3.3 mm wavelength on 27 and 28 October 2007 UT. These observations, carried out with the IRAM Plateau de Bure interferometer, provided images of the dust coma at ~6″ angular resolution which corresponds to 7100 km diameter at the comet distance. The observations and data products are presented in Sects. 2 and 3. They were analysed with a model of dust thermal emission coupled with a time-dependent model of the expansion of the cloud. The modelling approach is described in Sect. 4 and the data analysis is done in Sect. 5. A discussion of the results obtained on the properties of the dust ejecta follows in Sect. 6. A preliminary report of the observations was given by Boissier et al. (2008, 2009).
2. Observations
Observations were undertaken on 26.92−27.29 and 28.08−28.33 October 2007 UT at the IRAM Plateau de Bure interferometer (PdBI) situated in the French Alps (Guilloteau et al. 1992). Therefore, they were performed soon after the announcement of the comet outburst on 24 October (Green 2007) as a Target of Opportunity program. The comet was at a geocentric distance Δ ~ 1.63 AU and a heliocentric distance rh ~ 2.45 AU. The Sun was at a position angle PA = 38−39° on the plane of the sky, and the phase (Sun-Comet-Earth) angle was ~16°. The comet was tracked using the ephemeris provided by the HORIZONS system (solution JPL K077/6). At the time of the observations, the six 15-m antennas of the interferometer were set in the compact D configuration. On 27 October, only five antennas were available. The baseline lengths projected onto the plane of the sky ranged from 15 to 100 m. The uv-coverage acquired over the course of observations is presented in Fig. 1.
The observations were performed using the 3-mm dual polarization (4-GHz bandwidth) receivers tuned to the frequencies of the J(1−0) HCN (88.6 GHz) and J(1−0) HNC (90.6 GHz) lines on 27 and 28 October, respectively. The two polarizations were observed using the 8 units of the Plateau de Bure correlator: for each polarization, one unit of 20 MHz bandwidth was centred on the molecular line, and three 320 MHz units were placed nearby for measuring the continuum emission. The effective total bandwidth for the continuum observations was thus about 2 × 0.9 GHz. The observing cycle was typically: pointing, focussing, cross-correlation on a calibration source, 2 min of autocorrelation (ON–OFF measurements, 1 min on source, for line observations with the angular resolution of the primary beam) and 30 scans (45 s each) of cross-correlation on the comet. A log of the observations is presented in Table 1. The angular resolution of the synthesized beam is ~6.4″ and 5.5″ on 27 and 28 October, respectively and the Half Power Beam Width (HPBW) of the primary beam is about 54″ at the observed frequencies. The analysis of the HCN and HNC data (cross-correlation, i.e. interferometric mode, and ON–OFF measurements) will be presented in a forthcoming paper.
The data reduction was done using the GILDAS software package (Pety 2005). For both datasets (27 and 28 October) the bandpass calibration was carried out observing 3C 454.3. The instrumental phase and amplitude variations were deduced from observations of the calibrator 0355+508. The weather conditions at the Plateau de Bure were outstanding, and the resulting phase rms is at most 20°, with values lower than 15° for most of the antenna pairs. Finally the absolute flux density scale was determined from measurements of 3C 84 and MWC 349 fluxes. The consistency (within 2.5%) of the calibrator fluxes measured on 27 and 28 October implies an excellent relative calibration between the two dates. The uncertainty in the absolute flux calibration is about 15% for both days.
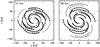 |
Fig. 1 uv-coverage for 27 and 28 October. The (u,v) points in black represent the part common to the two dates. |
Position of the brightness centre.
The interferometric maps deduced from the whole data set are presented in Fig. 2 and their main characteristics (flux density at the centre of the map and astrometric position of the peak of brightness) are reported in Tables 1 and 2. Note that the maps have been centred on the position of the peak of brightness. The comparison of the 27 and 28 October maps is difficult due to differences in the shape and size of the interferometric beam, caused by different uv-coverages. Maps obtained with a similar uv-coverage using restricted data sets (from 2h00 to 7h00 UT, same 5 antennas for both dates) are also presented in Fig. 2, and their characteristics are given in the second part of Tables 1, 2.
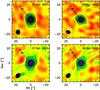 |
Fig. 2 Interferometric maps of the 3.3 mm continuum emission of comet 17P/Holmes obtained on 27 and 28 October 2007 UT with PdBI. Top: full set of measurements. Bottom: maps constructed using the same uv-coverage, i.e., from data acquired with 5 antennas and between 2h00 and 7h00 UT for both dates. The interferometric beam is plotted in the bottom left corner. The maps have been centred on the position of maximum brightness. The arrow represents the Sun direction projected on the sky. The level spacing is 2σ, with σ = 0.093 (top figure) and 0.10 (bottom) mJy/beam for 27 October, and σ = 0.12 (top) and 0.14 (bottom) mJy/beam for 28 October. |
3. Data analysis
The detected 3.3 mm emission is due to the thermal emission of dust particles in the coma. Indeed, a flux density of 2 mJy at 90 GHz would correspond to a photometric diameter of 60 km for a spherical slow rotator at the equilibrium temperature of 207 K expected at 2.45 AU from the Sun. Instead, the effective diameter of the nucleus of 17P/Holmes is estimated to be 3.2 km (Snodgrass et al. 2006).
The first interesting feature in these 3.3-mm continuum measurements is the small variation of the flux density in 24 h elapsed time. The peak flux density within the ~5−6″ field-of-view decreased by 20−25% only between the two dates (Table 1).
3.1. Astrometry and azimuthal variations
As seen in Table 2, the astrometric position of the maximum brightness (O) almost coincides with the position of the nucleus given by the ephemeris (C). An (O−C) offset of ~+0.3″ at the 1-σ confidence level is measured in Declination for both dates when considering the whole data set. On optical images, the inner coma of 17P/Holmes presents an asymmetric distribution, mainly characterized by the presence at the position angle PA = 220° (corresponding to the anti-Sun direction) of a bright elongated cloud (so-called “blob”), quickly separating at a rate of 9−10″/day from the (much brighter) condensation of material surrounding the nucleus (Montalto et al. 2008; Watanabe et al. 2009; Reach et al. 2010). The (O−C) marginal offsets measured in the PdBI maps (PA within 0−60°) are not towards the direction of this expanding blob: besides the uncertainty of the measurements and of the comet ephemeris, they can be due to spatial asymmetries of the brightness distribution in either direction. At the time of our observations, the blob was at a projected distance of ~17″ (27 October) and 27″ (28 October) from the nucleus (Montalto et al. 2008; Watanabe et al. 2009), i.e., at the edge of the primary beam of the PdBI antennas that defines the extent of the interferometric map. Its thermal emission is not seen in our images (Fig. 2). Thus, the amount of millimetre-sized dust particles in this blob was too low with respect to the amount of material surrounding the nucleus for a detection in the PdBI maps. We have also to consider that more massive particles have lower expansion velocities and are less subject to radiation pressure, so that this bright blob of micrometric particles seen in optical and infrared images was likely deficient in particles radiating at 3.3 mm. Comparing optical and infrared images, Reach et al. (2010) concluded that the blob comprised particles of intermediate (~10 μm) sizes.
Spatial asymmetries are marginally present in the PdBI maps. To enhance spatial features, we subtracted a symmetric image to the measurements. The subtraction was done in the Fourier plane, that is, we subtracted the visibilities characterizing the symmetric image to the measured visibilities. Interferometric maps were then produced with the new sets of visibilities (i.e., uv-tables). The visibility amplitude  of the symmetric images follows = 0.052
 Jy and
  Jy, for 27 and 28 October, respectively. This corresponds to the angular average of the data in the Fourier plane described in Sect. 3.2. Figures 3d,h show, for the two observation dates, the residual interferometric images. We also plot residual images obtained by applying a factor f = 0.8 (Figs. 3b,f) and 0.9 (Figs. 3c,g) to visibilities of the symmetric images. An emission feature is observed at the 2σ level South-East from the nucleus position (PA ~ 160°), in the 27 October residual images obtained for f = 0.9 and 1.0. As a matter of fact, this feature is discernable on the 27 October original map (Figs. 2 left and 3a). Its intensity is ~10% the peak intensity in the centre of the 27 October map. This feature is not present in the 28 October images. More marginal features at the noise level (1σ) are observed at position angles corresponding approximatively to the Sun direction (27 October), and to the tail direction (28 October) (PA(Sun) = 38°, PA(tail) = 218°). All these features are also observed when the restricted data sets are used. We show in Sect. 5 that the velocity of the 1-mm sized particles in the expanding shell is 50−100 m s-1. This is compatible with the disappearance of the southward feature in the PdBI map of 28 October.
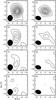 |
Fig. 3 Asymmetries in the interferometric 3.3 mm maps of comet 17P/Holmes from image processing. Results for 27 and 28 October are plotted in left a)−d) and right e)−h) panels, respectively. Top figures a), e): observed images as in Fig. 2. All other figures have had a symmetric image subtracted (in the Fourier plane) to enhance azimuthal asymmetries. The symmetric images for 27 and 28 October are described by the fits of the visibilities given in Fig. 4, multiplied by a factor f equal to 0.8 b), f), 0.9 c), g), and 1.0 d), h). The interferometric beam is plotted in the bottom left corner. The level spacing is 1σ, except for the top figures (2σ, see Fig. 2), with σ = 0.093 mJy/beam for images a)−d), and σ = 0.12 mJy/beam for e)−h). Dashed contours correspond to negative fluxes. |
3.2. Radial distribution
The data provide information on the radial distribution of the emission at projected distances D of typically 3500 to 20 000 km from the nucleus (this corresponds to the range of λ/Bl projected at the distance of the comet, where Bl is the baseline length and λ is the wavelength). For comets observed in steady-state activity, the column density and brightness distribution of the dust in the inner coma is expected to vary in first approximation according to 1/D, not considering deviations from this ideal law caused by radiation pressure, particle fragmentation, and asymmetries related to the nucleus outgassing geometry. There are several examples of surface brightness profiles at millimetre and submillimetre wavelengths consistent with this ideal law (e.g., Jewitt & Matthews 1999; Bockelée-Morvan et al. 2010b). On the other hand, when observations are conducted soon after a massive outburst, the radial profile may strongly differ from this law. The profile may resemble that of a point-like source, if the size of the expanding cloud is much smaller than the angular resolution of the interferometric beam. Taking into account the elapsed time between the outburst onset time and the PdBI observations, this would happen for grains with velocities significantly less than 10 m/s. Conversely, if the millimetre-sized particles that contribute to the emission have sufficiently high velocities, a ring-like structure, arcs or bright condensations (not coinciding with the nucleus position) can be observed, depending on the geometry of the expansion. In the present case, this is not observed. Finally, a variety of profiles, eventually approaching the 1/D law in restricted regions of the coma, can be observed if the outburst was followed by a sustained production of millimetre-sized particles (e.g., due to dust fragmentation) and/or if the particles contributing to the signal have a broad range of velocities. The decline of the dust emission from 27 and 28 October is governed both by the production curve of the particles and their velocity.
As discussed in Boissier et al. (2007), an appropriate way to study the radial distribution of material observed by interferometric techniques is from the analysis of the visibilities which are the direct output of interferometers. This method allows us to avoid uncertainties in the maps resulting from the partial uv-coverage (see Fig. 1). In addition, due to filtering and missing data at short antenna-spacings, maps lose information concerning the comet emission at large scales (see Fig. 2 where the emission is barely detected at D > 10″). Observed visibilities have been azimuthally averaged in the uv-plane to investigate the radial brightness distribution. Figure 4 displays the visibility amplitudes as a function of uv-radius ruv (the baseline length projected onto the plane on the sky) for the two dates. They vary according to  and
and  for 27 and 28 October, respectively. The radial variation of the visibilities is indicative of a more compact distribution than expected for a 1/D variation of the column density. For such a distribution, a
  variation would have been observed (Bockelée-Morvan et al. 2010a) ( independent of uv-radius characterizes compact sources unresolved by the interferometic beam). A 23% decline of the emission is observed at ruv ≤ 30 m between the two dates, whereas the visibility at ruv > 60 m is constant, within the uncertainties.
4. Modelling
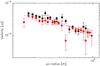 |
Fig. 4 Visibilities measured on 27 (black symbols) and 28 (red symbols) October. Dashed lines show fitted dependences with uv-radius: 0.052 |

4.1. Dust thermal emission
Models of the thermal emission of cometary dust in the microwave domain have been presented by Jewitt & Luu (1990, 1992). The radiation of dust grains at λ = 3.3 mm depends of the grain absorption efficiency factor Qabs, which is a function of the grain size and of the complex refractive index mλ of the material. We calculated Qabs at λ = 3.3 mm for different mixtures of silicates, organics and water ice using the Mie theory for spherical and homogenous grains. Infrared signatures of water ice grains were observed in the coma of 17P/Holmes, and lifetime calculations indicate that dirty and pure ice grains with a > 100 μm survived for several days or more after the outburst (Yang et al. 2009). We also considered the porosity of the grains. The effective mλ of fluffy grains was computed in a two-step process. First, we computed the refractive index of basic units made of silicates and water ice using the Maxwell Garnett effective medium theory (EMT) following Greenberg & Hage (1990). Mixtures of organics and ice, as well as mixtures of different silicates were also considered (Table 3). The effective refractive index of the fluffy particles was then deduced using the Maxwell Garnett formula for two-component mixtures, taking vacuum for the core material and the silicate/ice or organic/ice mixture in the matrix (hollow sphere). This prescription was used by Kruegel & Siebenmorgen (1994) for modelling Qabs of interstellar dust. EMT theories are only an approximation to the real optical behavior of composite media, and give more accurate results when the size of the grains is small relative to the wavelength, and when the volume of the inclusions (here silicates, organics and voids) is small with respect to the matrix (Ossenkopf 1991; Perrin & Lamy 1990). The use of more exact theories is beyond the scope of this paper.
Optical constants m = n − ik at 3.3 mm.
The refractive indices used in this study are given in Table 3. We considered different materials, with optical constants which might be representative of cometary material (Hanner & Bradley 2005). Optical constants at 3.3 mm are rare in the literature. The value for the silicate mixture made of forsterite and astronomical silicates was computed with the Maxwell Garnett formula, with forsterite constituting the matrix. We considered aggregates with a relative ice mass fraction Mice/(Mice + Mdirt) from 0 to 48% (where dirt refers to silicates or organics) and a porosity from 0 to 0.8.
If the dust properties (size distribution and chemical properties) do not vary within the instrumental field of view, the flux density (W m-2 Hz-1 or Jy) may be written as (e.g., Jewitt & Luu 1990): 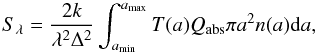 (1)where n(a) ∝ aq is the size distribution, q is the size index in the coma, and amin and amax are the minimum and maximum grain radii. T(a) is the temperature of the grains which, for the purpose of modelling thermal emission at 3.3 mm, can be assumed in first approximation to be independent of size (Jewitt & Luu 1990) and described by the blackbody equilibrium temperature of fast-rotating bodies of 174 K at 2.45 AU. The Rayleigh-Jeans approximation for the blackbody grain emission applies. The flux density is then related to the mass of emitting grains M through the so-called dust opacity κλ:
  (2)with:
  (3)where ρ is the density of the grains. Densities of 1000, 1500, 2500 kg m-3 were taken for ice, organics, and silicates, respectively. To compute κλ, we used the effective density of the grains, which depends on the relative proportions of the materials and their porosity. For example, ρ = 723 kg m-3 for silicate grains with 50% ice content and a porosity of 0.5 (nominal composition considered in Sects. 4.2 and 4.3). Sample opacities at λ = 1 mm for non-porous grains made of various (one component) materials have been presented by Jewitt & Luu (1992). Table 4 presents dust opacities at 3.3 mm (k3.3 mm) for different ice/silicate mixtures, porosities and size distributions. The maximum size considered in the table is amax = 1000 mm, as evidence was found for cm-sized particles and even large-size fragments in 17P coma (Reach et al. 2010; Stevenson et al. 2010). When ice is included in the aggregates, the opacity ranges from 0.005 and 0.037 m2 kg-1 in the range of considered size indexes. For amax > λ = 3.3 mm, κ3.3 mm decreases with increasing amax because the larger particles, which are the most efficient radiators at millimetre wavelengths, contribute to the mass faster than they contribute to the radiating cross-section (Fig. 5). On the other hand, κ3.3 mm shows little dependence with amin. The absorption efficiency shows resonances at particle radii between 1 and 10 mm (i.e., at ~λ, Fig. 6), which are smeared out when the porosity increases. When the size distribution encompasses these resonances (amax = 100 and 1000 mm in the table), porosity enhances the dust opacity at 3.3 mm when the “hollow sphere” approximation is used (Fig. 5), whereas it does not influence the dust opacity when vacuum is taken to be the matrix in the Maxwell Garnett theory. For grains made of astronomical silicates, κ3.3 mm decreases for increasing amount of ice, as ice is more transparent than these silicates. κ3.3 mm is also smaller for grains containing organics or crystalline silicates (i.e., forsterite).
Dust opacities at 3.3 mm.
Applying Eq. (2) to the flux density of ~2.4 mJy/beam observed on 27 October, we derive a dust mass M = 0.8−6 × 10¹¹ kg for dust opacities in the range 0.005−0.04 m2 kg-1. Obviously, this mass is a lower limit to the dust mass produced by the outburst, since the beam encompasses only part of the coma.
Using the same approach, we computed opacities at 0.45, 0.8 and 1.2 mm which might be useful for the interpretation of comet observations carried out with the Atacama Large Millimeter and submillimeter Array (ALMA) (see Table 5).
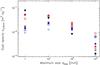 |
Fig. 5 Dust opacities at 3.3 mm for grains made of astronomical silicates. Values for 0% ice and porosity = 0, 0% ice and porosity = 50%, 48% ice and porosity = 50% are plotted with black, red, and blue symbols, respectively. Plain, open circles, and crosses are for size indexes q = −3, −3.5, and −4, respectively. |
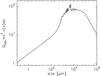 |
Fig. 6 Product Qabs(a) × πa2 × n(a)da for a size distribution in a-3.7 and absorption efficiencies at 3.3 mm of astronomical silicates with 0.5 porosity and 48% ice fraction. |
4.2. Time-dependent modelling
The in-depth analysis of the data requires a time-dependent model of the dust coma. Indeed, since the outburst produced dust particles and chunks with a broad range of velocities, the dust size distribution evolved in the coma, both with time and distance to nucleus. The velocity partitioning resulted in enhancing the relative fraction of large particles with respect to smaller ones in the inner coma, and might be observable on the visibility curves which sample a broad range of distances to nucleus. Alternatively, the visibilities at the different baseline lengths (i.e., uv-radius) may sample particles produced with similar kinematic properties but at different times.
The number of particles injected in the coma by the outburst as a function of time is modelled by a function G(t) peaking at t = t0 (23.3 October UT, according to Hsieh et al. 2010). G(t) is described by the combination of two half Gaussians peaking at equal values, with widths ΔToutburst for t > t0, and ΔToutburst/4 for t < t0. The effective width of G(t) is thus 5/8 × ΔToutburst. This choice of function was initially motivated to accelerate the convergency of the computations.
The size distribution of the dust injected by the outburst follows a power law n(a) ∝ aq, defined by the size index q. The velocity of the dust particles is supposed to vary according to:  (4)where V0 is the velocity of a grain of radius a0 = 1 mm. We imposed Vdust(a) < 1 km s-1. It is worth mentioning that, for steady state dust production, the dust size index in the coma (that used in Sect. 4.1 for computing dust opacities) is equal to q + δ.
We assumed a spherical dust coma. The density distribution of dust grains of size a is given by:  (5)where r is the distance to the nucleus and t the time of the observation. The dust thermal emission by unit of solid angle [Jy sr-1] at impact parameter D from the nucleus is computed by integration along the line of sight (LOS) according to:
  (6)Visibilities as a function of uv-radius ruv are then computed from this brightness distribution, taking into account the finite size (with Gaussian shape) of the primary beam (see Boissier et al. 2007; Bockelée-Morvan et al. 2009). The optical properties of the individual grains are supposed not to vary with time, though sublimation-induced variations might be expected. The absorption efficiencies Qabs(a) are computed as explained in Sect. 4.1.
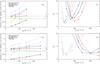 |
Fig. 7 Model results as a function of dust velocity parameter V0 for astronomical silicates with 0.5 porosity and 48% ice fraction. The outburst onset is t0 = 23.8 UT and the maximum dust size is amax = 100 mm (top figures a) and c)) and amax = 1000 mm (bottom figures b) and d)). Results for size indexes of q = −3 and q = −4 are plotted respectively with solid, and dotted lines, and full circles, and crosses. Left: visibility curves and interferometric-flux characteristics: |

In our calculations, the number of bins in particle sizes is typically 200−500. A high number of bins is a requisite for getting a continuous dust spatial distribution when summing Eq. (5) over size. Actually, the number of bins is fixed by the condition:  (7)to be fulfilled for all bins i.
One-component model: best fit for astronomical silicates with 0.5 porosity and 48% ice fraction.
The velocity of the dust particles is a critical parameter. Information is available for the small particles, from the evolution of the structure morphology of the expanding shell observed in optical images. The expansion of the edge of the shell is consistent with a velocity of ~550 m s-1 pertaining to particles in the 0.1−100 μm range (Lin et al. 2009; Hsieh et al. 2010). However, little is known on the kinematics of large grains. Particles are likely accelerated by their interaction with the flow of gas liberated by sublimating icy grains. For steady-state comas, the terminal velocity scales as a-0.5 for intermediate sizes (Crifo & Rodionov 1997). In order to roughly estimate the range of expected velocities V0 for 1-mm sized particles we performed a 1D dust dynamics modelling specific to comet 17P/Holmes using gas-drag coefficient for free molecular flow. Nucleus gravity is computed assuming a nucleus density of 1000 kg m-3. Gas dynamics is treated separately and assumes isentropic expansion. The gas total production rate was taken equal to 5 × 1030 s-1, based on the peak HCN production measured by Biver et al. (2008) on 25.9 October UT and the HCN/H2O relative abundance determined by Dello Russo et al. (2008). Under these assumptions, the terminal velocity of 1-mm radius particles is found to be 70 m s-1, with a size dependence for a = 100 μm to 10 cm close to δ = 0.5. The velocity of 1−100 μm particles ranges from 450 to 720 m s-1, approaching the gas velocity (800 m s-1) for the smallest sizes. The dynamics of 17P/Holmes’s coma after the explosive event was obviously more complex than this simple steady-state model. Because gases outflow more rapidly than grains, the local gas pressure in the dust ejecta cloud might have fastly declined with time, after the peak of gas production, reducing dust acceleration. For a gas production 10 times lower, the steady-state model predicts a terminal velocity for 1-mm particles ~3 times lower. For the calculations, we have assumed δ = 0.5 and considered velocity values V0 between 10 and 250 m s-1.
5. Results
5.1. One-component models
Simulations were performed with an outburst of short duration (ΔToutburst = 0.3 d) compared to the elapsed time between outburst onset and PdBI observations (see further discussion at the end of Sect. 5.1). We investigated several outburst onset times: 23.3 UT, 23.8 UT and 24.3 October UT. Indeed, though the onset time was established to be 23.3 UT by Hsieh et al. (2010), this is somewhat disputed (Z. Sekanina argues for an outburst occurring 0.4 d later, see note added in proof in Li et al. 2011). In addition, the maximum rate of brightening at optical wavelenths occurred on 24.5 October UT (Li et al. 2011).
The simulations were performed for astronomical silicates mixed with water ice (48% in mass) and a porosity of 0.5. Figures 7a,b plot, as a function of the velocity parameter V0 and for δ = 0.5 (Eq. (4)), several quantities characterizing the evolution of visibilities from 27 to 28 October: the ratios  at ruv = 20 m and 70 m, and the ratio of the flux density within the interferometric beam F28 Oct./F27 Oct.. Also plotted is the slope index qv for 27 October, defined according to
  ∝
∝  . The observed values of these quantities are also given in the figure. We see that there is a correlation between qv and the decrease of F and from 27 to 28 October. Larger grain velocities lead to a faster decrease of the flux density and to a more extended coma, which, in the Fourier plane, results in a faster decline of with ruv (i.e., large qv, Fig. 7). Alternatively, for low velocities, the dust coma remains unresolved for most baselines and qv approaches the zero value characterizing an unresolved source. For a large enough dust parameter V0, the material contributing to the 3.3 mm emission forms a ring of particles which inner boundary has a size comparable or larger than the interferometric beam, and the real part of the visibility becomes negative at large ruv. This is unlike the measurements, implying that low-velocity particles present near the nucleus are detected with the longest baselines at the two dates. Model results shown in Fig. 7 consider maximum size particles amax equal to 100 and 1000 mm. When amax is set to 10 mm, only a small size range is contributing to the 3.3 mm radiation (Fig. 6). This thin shell of radiating grains rapidly moves through the field of view. Visibility curves then display either a small ruv dependence (unresolved shell, low qv) or the shape characteristics of a ring-like structure explained above (steep ruv dependence and real part with negative values at large ruv). For t0 = 23.8 h, the transition between the two cases is obtained for V0 ~ 20−30 m s-1 (consistent with V0 × (t − t0) ~ FOV radius).
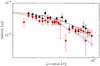 |
Fig. 8 Visibility curves with the one-component model, for an outburst with ΔToutburst = 25 000 s, a size distribution in a-4 with amax = 100 mm, a velocity law Vdust(a) = V0 (a/a0)-0.5 with V0 = 35 m s-1 being the velocity of 1-mm particles, and an outburst onset t0 = 23.8 UT. Data are shown by filled circles with error bars. The solid curves show the model results. Black (red) symbols and curves are for 27 and 28 October, respectively. Dust particles are made of a porous (50% porosity) mixture of astronomical silicates and ice, with an ice mass fraction of 48%. |
The observed visibilities were compared to the modelled curves. The resulting reduced  for the 27 and 28 October data, and for the fit of both 27 and 28 October data, are shown in Figs. 7c,d for t0 = 23.8 h and amax = 100 and 1000 mm. The velocities V0 providing the best are given in Table 6. V0 is lower for a steeper size distribution because the 3.3 mm emission is then sampling a relatively larger amount of small dust particules with larger velocities. For the same reason, V0 decreases with decreasing amax (Table 6). On the other hand, retrieved V0 are not very sensitive to the outburst onset time for t0 within 23.3−24.3 UT. For example, for amax = 100 mm, q = −3/−3.5/−4, V0 is ~75/60/40, 85/65/35, and 100/85/40 m s-1 for t0 = 23.3, 23.8, and 24.3 October UT respectively. Altogether, V0 values range from typically ~40 to 100 m s-1, with values as large as 200 m s-1 being obtained for the size distribution in a-3 (Table 6). Such high values are likely unrealistic as the velocities for 1-mm grains would then be comparable to the velocities measured for μm-sized grains from optical data (Lin et al. 2009; Hsieh et al. 2010). As indicated by the reduced , the observations are best fitted for steep size distributions (Table 6), with V0 ~ 30−40 m s-1. Figure 8 shows an example of model fits for a size distribution in a-4.
While satisfactory fits are obtained for the visibility curve obtained on 27 October ( ~ 1.2−1.5), the fit for 28 October is poorer (Figs. 7, 8). In fact, this one-component model fails in explaining the small temporal evolution of (70 m) (see Fig. 8) and the measured ratio F28 Oct./F27 Oct. of 0.80 ± 0.05 (see Table 6). Since replenishment of the coma (e.g., by fragmentation processes) proceeded after outburst onset, we could question the production function G(t) used in our model. Li et al. (2011) observed that the rate of change of the scattering cross-section followed a Gaussian-like function of ~0.4 d width and peaking on 24.54 October UT. Our G(t) function has the same width (note that model results are not much sensitive to the duration of injection of material, provided this duration remains small with respect to the elapsed time between outburst onset and the measurements). Model calculations with t0 ≃ 24.5 October UT do not explain the measurements. In other words, the production of the 3-mm radiating particles did not proceed as for the micron-sized particles. The longest baselines probe typically distances from the nucleus r ≤ 4000 km. The constancy of for ruv > 60 m over Oct. 27−28 suggests that the outburst produced a second population of very slowly moving grains which 3-mm emission remained unresolved by the interferometric beam on both dates. This population of slowly moving grains produced by the outburst has been identified in mid-infrared images and referred as to the “core” component (Reach et al. 2010). Its origin will be discussed in Sect. 6. In the next section, our model will incorporate this second population of debris.
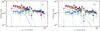 |
Fig. 9 Visibility curves for the two-component model. Model curves from the shell emission and residuals (data minus shell emission) are shown by a green (blue) line and green (blue) plain circles, respectively, for 27 (28) October UT. Parameters for the shell emission are: outburst with ΔToutburst = 25 000 s, t0 = 23.8 UT, and a size distribution in a-4: a) V0 = 50 m s-1, amax = 10 mm; b) V0 = 85 m s-1, amax = 100 mm. The point source (core) emission is shown with the dashed black line. The sum of the shell and core emissions are shown in solid lines. Data are shown by filled circles with error bars. Black (red) symbols and curves are for 27 and 28 October, respectively. Dust particles are made of a porous (50% porosity) mixture of astronomical silicates and ice, with an ice mass fraction of 48%. |
5.2. Two-component models
Two-component model: best fit for astronomical silicates with 0.5 porosity and 48% ice fraction.
In order to characterize the unresolved population of slowly moving grains, we fitted the observations by the combination of emission of outflowing dust grains (hereafter refered as “shell”), and a point-source emission (the “core” component). The shell emission is modeled as described in Sects. 4.2 and 5.1. The flux density from the core was determined from the constraint that the core remained unresolved on 27 and 28 October. Figures 9a,b show, for two sets of parameters, the modelled visibilities for the two components and the comparison to the measurements. At ruv > 60 m, the ratio / is 1−1.2, consistent with the measured value of 1.05 ± 0.15 (see Fig. 7). The best fits are obtained for grain velocities in the shell higher than determined from the one component model. The results of this two-component modelling are summarized in Table 7. The flux density from the core is in the range 0.9−1.6 mJy. The highest values are obtained when amax = 10 mm. In this case, the 3.3 mm-radiating shell has a small thickness and its inner boundary is larger than the interferometric beam, so that most of the emission detected with the long baselines is from the material composing the core (Fig. 9a). Residuals between modelled and observed maps are shown in Fig. 10 for the set of model parameters of Fig. 9b.
The PdBI observations do not provide strong constraints on the kinematic properties of the dust particles composing the core. As already discussed in Sect. 3, the mean velocity  of the core should not exceed 10 m s-1 to remain unresolved by the PdBI on the two dates. Instead, we used published continuum measurements obtained at 250 GHz (i.e., 1.1 mm wavelength) using the IRAM 30-m telescope (HPBW = 11″) which cover the 16 November to 18 December period (Altenhoff et al. 2009). Absorption coefficients were computed at 1.1 mm, following Sect. 4.1. Figure 11 shows the measurements of the dust continuum flux at 1.1 mm, where the 3.3 mm flux densities recorded at the PdBI were extrapolated to 1.1 mm, based on our calculations of dust opacities at the two wavelengths. Because they were performed late after the outburst, the IRAM 30-m telescope detected mainly emission from the low-velocity particles composing the core (see the modelled time evolution of the shell emission in Fig. 11). This is in agreement with the conclusion obtained by Reach et al. (2010) combining IRAM and Spitzer data sets. The time evolution of the core emission depends on the particle size distribution and velocity field. Examples of model fits for q = −3.2 (Sect. 5.3) are given in Fig. 11. The velocity of 1-mm particles in the core is typically V0 = 7−9 m s-1. The velocity of the largest particles (0.1 m) is on the order of the escape velocity (estimated to 0.8 m s-1). From mid-infrared images of the core obtained in March 2008, Reach et al. (2010) inferred a velocity of 9 m s-1. The agreement with our result is excellent.
5.3. Dust masses and size indexes
The time-dependent model allows us to compute not only the mass of dust particles within the field of view at the time of the measurements  , but also the total mass injected by the outburst
  . These quantities are given in Tables 6 and 7 for the one-component and two-component models, respectively. For the shell, differs from measured on 27 October by a factor of 2 to 12, the largest difference being obtained for the size distributions with size index q = −4 (Table 7). Most of the initial mass is then comprised in small, rapidly moving particles which are outside the PdBI field of view on 27 October. The dust mass found in the shell component ranges from 3 to 16 × 1011 kg (Table 7). However, models requiring velocities as large as 250 m s-1 for 1-mm particles can be excluded (Sect. 4.2). Therefore, values in the range 3−10 × 1011 kg are more likely, under the assumption that the optical properties assumed for our calculations are representative of comet grains.
For comparison with optical data, Tables 6 and 7 present total dust scattering cross-sections  inferred for the different models, assuming minimum particle sizes in the range amin = 0.1−1 μm. Particles with sizes less than 0.1 μm are not considered as they do not scatter efficiently visible light. The scattering cross-section measured from optical observations reached 5.5 × 10¹³ m2 at the peak of brightening on ~25.0 October UT (Li et al. 2011). For amin = 1 μm, the best fit for the two-component model implies = 1.6−3.3 × 10¹² m2 for q = −3.5, and = 70−95 × 1012 m2 for q = −4 (Table 7), which suggests a size distribution in the shell component close to a-4 if the minimum size is 1 μm. From interpolation, we found that the size index fitting both optical and radio data is q ~ −3.7 for amin = 0.1 μm and −3.9 for amin = 1 μm. These values are obtained for astronomical silicates mixed with water ice and a porosity of 50%. Taking into account the range of grain compositions and porosities considered in Table 4, q is within [−3.8, −3.6] and [−4.1, −3.8], for amin = 0.1 and 1 μm, respectively. The inferred size index is not significantly sensitive to amax. However, our model is not considering time-dependent dust production processes, such as particle fragmentation, responsible for the rapid increase of the scattering cross-section after outburst onset (Hsieh et al. 2010; Li et al. 2011). This introduces additional uncertainties in the size index determination.
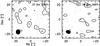 |
Fig. 10 Residuals obtained from the difference between observations and the two-component model. Model parameters are those of Fig. 9b. Left: residuals for 27 October. Right: residuals for 28 October. The levels are 1σ spacing with σ = 0.093 and 0.12 mJy/beam for October 27 and 28, respectively. The synthesized interferometric beam is plotted in the left corner. |
The size distribution in the core component can be evaluated from optical data contemporaneous to PdBI data. We assumed that the bright condensation surrounding the nucleus seen in optical images is the visible counterpart of this core component. From images obtained by Biver & Nicolas (priv. comm.) on 26.9 and 27.8 October UT, the scattering cross-section in a 6″ diameter aperture corresponding to the PdBI field of view was 0.7 and 0.4% the total scattering cross-section, implying a scattering cross-section of at most ~3.5 × 10¹¹ m2 in the core on 27.1 October UT. The small variation of the cross-section from 27 to 28 October can be interpreted as indicative of slowly moving particles (~15 m s-1, if we assume that dust production from the nucleus or from fragmentation was negligible between the two dates). The Qabs-weighted cross-section of 3 mm-radiating particles derived from the 1.3 mJy flux density (Table 7) is 1.8 × 10⁹ m2. The comparison with the scattering cross-section shows that the core contained a larger proportion of large particles, compared to the shell. Assuming amin = 0.1 μm and amax = 10 to 1000 mm, optical and radio data can be reconciled with a size index of −3.2 to −3.0. The results are not much sensitive to the minimum particle size: q is within [−3.3, −3.0] for amin = 1 μm. Using these size indexes, we derive dust masses for the core of 0.7, 1.2, and 3.7 (× 1011) kg for amax = 10, 100, and 1000 mm, respectively. Optical and radio data cannot be both explained for maximum grain sizes set to <2 mm. These calculations pertain to the nominal composition (50% astronomical silicate, 48% ice, porosity of 0.5). Considering the range of dust composition and porosity in Table 4, q remains within [−3.35, −3.0] for amin = 0.1 μm. Given uncertainties in the size distributions for the two components, especially on amax, the ratio  is in the range 0.1−1.
In summary, we derived dust masses of 3−10 × 1011 kg and 0.7−4 × 10¹¹ kg for the shell and core components, respectively. These calculations are valid for astronomical silicates mixed with water ice, with a porosity of 0.5. Additional uncertainties come from the optical properties of the dust ejecta which are not precisely known. Based on our calculations of dust opacities for different materials (Table 4), dust masses could be 60% higher (material referred as to organics and silicate mixture in the table) or up to a factor 2.6 lower (higher porosity, ice-free).
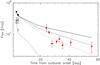 |
Fig. 11 Evolution of the 250 GHz flux from IRAM 30-m telescope (red dots, Altenhoff et al. 2009) and PdBI data (black dots). PdBI 90-GHz fluxes were converted to 250 GHz fluxes, applying a conversion factor of 22.1 determined by thermal modelling. The beam size is HPBW = 11″ for the 30-m data and ~6″ for the PdBI data. The observed core (Table 7) and shell emissions on 27−28 October are shown by opened circles and triangles, respectively. The dotted-dashed line shows the model for the shell emission (q = −4, amax = 100 mm, V0 = 85 m s-1) with HPBW = 6″ for the two first dates, and 11″ later on. Two-component models (shell+core) are shown with solid, dashed and dotted lines, with the core parameters being q = −3.2 and (amax = 100 mm, V0 = 5 m s-1), (amax = 100 mm, V0 = 9 m s-1), and (amax = 10 mm, V0 = 7 m s-1), respectively. |
6. Discussion
We performed a detailed analysis of the 3.3 mm dust thermal emission from comet 17P/Holmes observed 4−5 days after its massive outburst with the IRAM Plateau de Bure interferometer. The data were combined to optical and IRAM 30-m telescope measurements to characterize the properties of the ejecta cloud, namely the dust size distribution, its kinematics and mass.
Two distinct dust components, with different kinematic properties and size distributions, are identified in the data. The large-velocity component, with typical velocities V0 of 50−100 m s-1 for 1 mm particles, corresponds to the fast (550 m s-1) expanding shell observed in optical images and displays a steep size distribution with a size index estimated to q = −3.7. The size dependence of the velocity is consistent with gas drag (Sect. 4.2). The very high gas production rates measured shortly after the outburst (> 1030 s-1) and their fast temporal drop-off argue for gas production from subliming icy grains (Biver et al. 2008; Combi et al. 2007; Schleicher 2009). High gas pressures caused the particles constituting the shell to be accelerated to large terminal velocities. The second component, the “core”, consists in slowly-moving particles with kinematic properties (V0 = 7−9 m s-1) consistent with results obtained by Reach et al. (2010) from the study of mid-infrared images. Constraints obtained on the size index and maximum dust size show that the core is dominated by large (amax > 2 mm) particles with a shallow size index |q| < 3.4. The same conclusion was obtained by Reach et al. (2010) from the analysis of the Spitzer images. In addition, the core revealed featureless 10-μm spectra in mid-November 2007, in contrast to the shell, consistent with much larger grains populating the core (Reach et al. 2010).
The origin of the low-velocity core component may be related to the fast decline of the gas pressure with time in the inner coma resulting from the fast (>1 km s-1, Boissier et al. 2009) expansion of the first generation of gases. Under such conditions, we expect gas velocities to vary both with time and distance to nucleus, with the older molecules present at larger distances reaching higher velocities, and this was indeed observed (Biver et al. 2008; Boissier et al. 2009). The fast decline of gas pressure and velocity in the inner coma resulted in a strong decrease of the gas aerodynamic force acting on grains, making their acceleration less effective. Grains produced after the peak of gas production were thus accelerated to lower terminal velocities. Another effect to consider is that efficient grain acceleration requires gas pressure gradient. Particles in the centre of the expanding cloud were subject to limited acceleration since the gas pressure gradient caused by the subliming grains was minimum in this region. Finally, slowly-moving particles, in the trailing side of the ejecta cloud, were decelerated due to the positive gradient of pressure in the radial direction combined with nucleus gravity. The kinematics of the most massive debris was possibly not significantly affected by gas-drag; providing they were not accelerated by rocket forces, their velocity remained close to their separation velocity from the nucleus. Thus, the low velocity of the particles and debris composing the core might have different origins.
We derived dust masses of 3−10 × 1011 kg and 0.7−4 × 10¹¹ kg for the shell and core, respectively, using grains made of astronomical silicates mixed with water ice as cometary analogues. The ratio is in the range 0.1−1, lower than the value ~2 determined by Reach et al. (2010). The large mass in the shell component and its steep size distribution indicate that the disruption of the nucleus was accompanied or followed by a massive production of small particles, indicative of material with small cohesive strength.
We found that the total dust mass Mdust injected by the outburst was in the range 4−14 × 1011 kg. This is in the high end of reported values based on optical or infrared observations. From optical observations, Li et al. (2011) estimated Mdust to 0.2−9 × 10¹¹ kg, while Schleicher (2009) and Sekanina (2008) favour values of 1−2 × 10¹¹ kg. The estimate made by Reach et al. (2010) from their Spitzer thermal observations is 0.1 × 10¹¹ kg. The inconsistency between these concurrent measurements reflects different assumptions on the size distribution, especially on the maximum particle size in the ejecta. For example, Reach et al. (2010) made their estimations using characteristic sizes in the core, blob and shell components of 200, 8 and 2 μm, respectively, so that their values are lower limits to the dust masses.
The total dust mass is about 10 times higher than the integrated water production of ~5 × 10¹⁰ kg over several months (Biver et al. 2008; Schleicher 2009). Most of the water was produced on a timescale of the order of the day after outburst onset from small dirty icy grains. On-going gas production was observed through March 2008 (Schleicher 2009). The spatial distribution of OH radicals suggests outgassing from the inner part of the coma, typically <1−2 × 10⁴ km according to Schleicher (2009). A significant contribution from the icy debris in the core is likely, though detailed modelling is required to investigate whether this interpretation is consistent with the observed radial distribution of OH. As discussed by Schleicher (2009), the source of the low production observed in March 2008 is more likely the nucleus.
Assuming a nucleus bulk density equal to the dust density (700 kg m-3, Sect. 4.2), the mass ejected by the outburst is 3−9% the nucleus mass, and corresponds to a cube having a side length of 0.8−1.2 km. In other words, the dramatic outburst experienced by 17P/Holmes was caused by a massive disruption of part of its nucleus. Possible mechanisms for comet splitting are discussed by Boehnhardt (2005). The simple fact that 17P/Holmes also experienced massive outbursts in 1892 and 1893 indicates that the outburst was not induced by a collision with another body. The idea that the outburst was triggered by the exothermic phase transition of buried amorphous water ice is defended by Sekanina (2008), Reach et al. (2010), and Li et al. (2011). However, from thermal modelling of nucleus interior, Kossacki & Szutowicz (2010) reach the conclusion that this process is unable to explain such a massive fragmentation. The origin of the fragmentation of comet 17P/Holmes remains elusive.
7. Summary
The 3.3-mm continuum emission from comet 17P/Holmes was observed with the Plateau de Bure interferometer 4−5 days after its dramatic 2007 outburst. The main results of a detailed analysis of these observations are:
-
The peak position of the brightness distribution coincideswithin 1.5σ with the nucleus position. Some excess emission is detected southward the nucleus position on 27 October. This excess emission disappeared on 28 October.
-
Two distinct dust components with different kinematics properties are identified in the data.
-
The large-velocity component, with typical velocities V0 of 50−100 m s-1 for 1 mm particles, displays a steep size distribution with a size index estimated to q = −3.7 for the nominal silicate-ice mixture assuming a minimum grain size of 0.1 μm (q within [−3.8, −3.6] considering a wide range of mixtures and porosities). It corresponds to the fast expanding shell observed in optical images. Velocities are consistent with acceleration by gas pressure resulting from the sublimation of icy grains.
-
The slowly-moving component (V0 = 7−9 m s-1), referred to as the core, has a shallower size index |q| < 3.4, compared to the shell. These particles were not efficiently accelerated by gas drag. The dust mass in the core is in the range 0.1−1 that of the shell.
-
Using optical constants pertaining to porous grains (porosity of 0.5) made of astronomical silicates mixed with water ice (48% in mass), the total dust mass Mdust injected by the outburst is estimated to 4−14 × 1011 kg, corresponding to 3−9% the nucleus mass. The dramatic outburst experienced by 17P/Holmes was caused by a massive disruption of its nucleus.
Online material
Dust opacities at 0.45, 0.8, and 1.2 mm.
Acknowledgments
We acknowledge the IRAM director P. Cox for scheduling these observations on a very short notice as a target of opportunity project and J.-M. Winters for his helpful work during the observations. We thank J. Nicolas (IAU station B51) for providing us optical images of comet 17P/Holmes. The research leading to these results received funding from the European Community’s Seventh Framework Programme (FP7/2007–2013) under grant agreement No. 229517.
References
- Altenhoff, W. J., Bieging, J. H., Butler, B., et al. 1999, A&A, 348, 1020 [NASA ADS] [Google Scholar]
- Altenhoff, W. J., Kreysa, E., Menten, K. M., et al. 2009, A&A, 495, 975 [NASA ADS] [CrossRef] [EDP Sciences] [Google Scholar]
- Biver, N., Bockelée-Morvan, D., Wiesemeyer, H., et al. 2008, LPI Contrib., 1405, 8146 [NASA ADS] [Google Scholar]
- Bockelée-Morvan, D., Henry, F., Biver, N., et al. 2009, A&A, 505, 825 [NASA ADS] [CrossRef] [EDP Sciences] [Google Scholar]
- Bockelée-Morvan, D., Boissier, J., Biver, N., & Crovisier, J. 2010a, Icarus, 210, 898 [NASA ADS] [CrossRef] [Google Scholar]
- Bockelée-Morvan, D., Hartogh, P., Crovisier, J., et al. 2010b, A&A, 518, L149 [NASA ADS] [CrossRef] [EDP Sciences] [Google Scholar]
- Boehnhardt, H. 2005, Comets II, ed. M. Festou, H. U. Keller, & H. A. Weaver (Tucson: The University of Arizona Press), 30 [Google Scholar]
- Boissier, J., Bockelée-Morvan, D., Biver, N., et al. 2007, A&A, 475, 1131 [NASA ADS] [CrossRef] [EDP Sciences] [Google Scholar]
- Boissier, J., Bockelée-Morvan, D., Biver, N., et al. 2008, LPI Contributions, 1405, 8081 [NASA ADS] [Google Scholar]
- Boissier, J., Bockelée-Morvan, D., Biver, N., et al. 2009, EM&P, 105, 89 [Google Scholar]
- Combi, M. R., Maekinen, J. T. T., Bertaux, J.-L., Quemerais, E., & Ferron, S. 2007, IAU Circ., 8905 [Google Scholar]
- Crifo, J. F., & Rodionov, A. V. 1997, Icarus, 127, 319 [NASA ADS] [CrossRef] [Google Scholar]
- Dello Russo, N., Vervack, R. J., Jr., Weaver, H. A., et al. 2008, ApJ, 680, 793 [NASA ADS] [CrossRef] [Google Scholar]
- Draine, B. T. 1985, ApJS, 57, 587 [NASA ADS] [CrossRef] [Google Scholar]
- Fabian, D., Henning, T., Jäger, C., et al. 2001, A&A, 378, 228 [NASA ADS] [CrossRef] [EDP Sciences] [MathSciNet] [Google Scholar]
- Gaillard, B., Lecacheux, J., & Colas, F. 2007, CBET, 1123, 1 [NASA ADS] [Google Scholar]
- Green, D. W. E. 2007, IAU Circ., 8886, 3 [NASA ADS] [Google Scholar]
- Greenberg, J. M., & Hage, J. I. 1990, ApJ, 361, 260 [NASA ADS] [CrossRef] [Google Scholar]
- Guilloteau, S., Delannoy, J., Downes, D., et al. 1992, A&A, 262, 624 [NASA ADS] [Google Scholar]
- Hanner, M. S., & Bradley, J. P. 2005, Comets II, ed. M. Festou, H. U. Keller, & H. A. Weaver (Tucson: The University of Arizona Press), 555 [Google Scholar]
- Hsieh, H. H., Fitzsimmons, A., Joshi, Y., Christian, D., & Pollacco, D. L. 2010, MNRAS, 407, 1784 [NASA ADS] [CrossRef] [Google Scholar]
- Jewitt, D., & Luu, J. 1990, ApJ, 365, 738 [NASA ADS] [CrossRef] [Google Scholar]
- Jewitt, D., & Luu, J. 1992, Icarus, 100, 187 [NASA ADS] [CrossRef] [Google Scholar]
- Jewitt, D., & Matthews, H. 1999, ApJ, 117, 1056 [Google Scholar]
- Kossacki, K. J., & Szutowicz, S. 2010, Icarus, 207, 320 [NASA ADS] [CrossRef] [Google Scholar]
- Kruegel, E., & Siebenmorgen, R. 1994, A&A, 288, 929 [NASA ADS] [Google Scholar]
- Li, J., Jewitt, D., Clover, J. M., & Jackson, B. V. 2011, ApJ, 728, 31 [NASA ADS] [CrossRef] [Google Scholar]
- Lin, Z.-Y., Lin, C.-S., Ip, W.-H., & Lara, L. M. 2009, AJ, 138, 625 [NASA ADS] [CrossRef] [Google Scholar]
- Montalto, M., Riffeser, A., Hopp, U., Wilke, S., & Carraro, G. 2008, A&A, 479, L45 [NASA ADS] [CrossRef] [EDP Sciences] [Google Scholar]
- Ossenkopf, V. 1991, A&A, 251, 210 [NASA ADS] [Google Scholar]
- Perrin, J.-M., & Lamy, P. L. 1990, ApJ, 364, 146 [NASA ADS] [CrossRef] [Google Scholar]
- Pety, J. 2005, in SF2A-2005: Semaine de l’Astrophysique Française, ed. F. Casoli, T. Contini, J. M. Hameury, & L. Pagani, 721 [Google Scholar]
- Pollack, J. B., Hollenbach, D., Beckwith, S., et al. 1994, ApJ, 421, 615 [NASA ADS] [CrossRef] [Google Scholar]
- Qi, C., Hogerheijde, M. R., Jewitt, D., et al. 2010, BAAS, 42, 947 [NASA ADS] [Google Scholar]
- Reach, W. T., Vaubaillon, J., Lisse, C. M., Holloway, M., & Rho, J. 2010, Icarus, 208, 276 [NASA ADS] [CrossRef] [Google Scholar]
- Schleicher, D. G. 2009, AJ, 138, 1062 [NASA ADS] [CrossRef] [Google Scholar]
- Sekanina, Z. 2008, ICQ, 30, 63 [Google Scholar]
- Sekanina, Z. 2009, ICQ, 31, 5 [NASA ADS] [Google Scholar]
- Snodgrass, C., Lowry, S. C., & Fitzsimmons, A. 2006, MNRAS, 373, 1590 [NASA ADS] [CrossRef] [Google Scholar]
- Stevenson, R., Kleyna, J., & Jewitt, D. 2010, AJ, 139, 2230 [NASA ADS] [CrossRef] [Google Scholar]
- Warren, S. G., & Brandt, R. E. 2008, JGR, 113, D14220 [Google Scholar]
- Watanabe, J.-I., Honda, M., Ishiguro, M., et al. 2009, PASJ, 61, 679 [NASA ADS] [Google Scholar]
- Yang, B., Jewitt, D., & Bus, S. J. 2009, AJ, 137, 4538 [NASA ADS] [CrossRef] [Google Scholar]
All Tables
One-component model: best fit for astronomical silicates with 0.5 porosity and 48% ice fraction.
Two-component model: best fit for astronomical silicates with 0.5 porosity and 48% ice fraction.
All Figures
|
Fig. 1 uv-coverage for 27 and 28 October. The (u,v) points in black represent the part common to the two dates. |
| In the text | |
|
Fig. 2 Interferometric maps of the 3.3 mm continuum emission of comet 17P/Holmes obtained on 27 and 28 October 2007 UT with PdBI. Top: full set of measurements. Bottom: maps constructed using the same uv-coverage, i.e., from data acquired with 5 antennas and between 2h00 and 7h00 UT for both dates. The interferometric beam is plotted in the bottom left corner. The maps have been centred on the position of maximum brightness. The arrow represents the Sun direction projected on the sky. The level spacing is 2σ, with σ = 0.093 (top figure) and 0.10 (bottom) mJy/beam for 27 October, and σ = 0.12 (top) and 0.14 (bottom) mJy/beam for 28 October. |
| In the text | |
|
Fig. 3 Asymmetries in the interferometric 3.3 mm maps of comet 17P/Holmes from image processing. Results for 27 and 28 October are plotted in left a)−d) and right e)−h) panels, respectively. Top figures a), e): observed images as in Fig. 2. All other figures have had a symmetric image subtracted (in the Fourier plane) to enhance azimuthal asymmetries. The symmetric images for 27 and 28 October are described by the fits of the visibilities given in Fig. 4, multiplied by a factor f equal to 0.8 b), f), 0.9 c), g), and 1.0 d), h). The interferometric beam is plotted in the bottom left corner. The level spacing is 1σ, except for the top figures (2σ, see Fig. 2), with σ = 0.093 mJy/beam for images a)−d), and σ = 0.12 mJy/beam for e)−h). Dashed contours correspond to negative fluxes. |
| In the text | |
|
Fig. 4 Visibilities measured on 27 (black symbols) and 28 (red symbols) October. Dashed lines show fitted dependences with uv-radius: 0.052 |
| In the text | |
|
Fig. 5 Dust opacities at 3.3 mm for grains made of astronomical silicates. Values for 0% ice and porosity = 0, 0% ice and porosity = 50%, 48% ice and porosity = 50% are plotted with black, red, and blue symbols, respectively. Plain, open circles, and crosses are for size indexes q = −3, −3.5, and −4, respectively. |
| In the text | |
|
Fig. 6 Product Qabs(a) × πa2 × n(a)da for a size distribution in a-3.7 and absorption efficiencies at 3.3 mm of astronomical silicates with 0.5 porosity and 48% ice fraction. |
| In the text | |
|
Fig. 7 Model results as a function of dust velocity parameter V0 for astronomical silicates with 0.5 porosity and 48% ice fraction. The outburst onset is t0 = 23.8 UT and the maximum dust size is amax = 100 mm (top figures a) and c)) and amax = 1000 mm (bottom figures b) and d)). Results for size indexes of q = −3 and q = −4 are plotted respectively with solid, and dotted lines, and full circles, and crosses. Left: visibility curves and interferometric-flux characteristics: |
| In the text | |
|
Fig. 8 Visibility curves with the one-component model, for an outburst with ΔToutburst = 25 000 s, a size distribution in a-4 with amax = 100 mm, a velocity law Vdust(a) = V0 (a/a0)-0.5 with V0 = 35 m s-1 being the velocity of 1-mm particles, and an outburst onset t0 = 23.8 UT. Data are shown by filled circles with error bars. The solid curves show the model results. Black (red) symbols and curves are for 27 and 28 October, respectively. Dust particles are made of a porous (50% porosity) mixture of astronomical silicates and ice, with an ice mass fraction of 48%. |
| In the text | |
|
Fig. 9 Visibility curves for the two-component model. Model curves from the shell emission and residuals (data minus shell emission) are shown by a green (blue) line and green (blue) plain circles, respectively, for 27 (28) October UT. Parameters for the shell emission are: outburst with ΔToutburst = 25 000 s, t0 = 23.8 UT, and a size distribution in a-4: a) V0 = 50 m s-1, amax = 10 mm; b) V0 = 85 m s-1, amax = 100 mm. The point source (core) emission is shown with the dashed black line. The sum of the shell and core emissions are shown in solid lines. Data are shown by filled circles with error bars. Black (red) symbols and curves are for 27 and 28 October, respectively. Dust particles are made of a porous (50% porosity) mixture of astronomical silicates and ice, with an ice mass fraction of 48%. |
| In the text | |
|
Fig. 10 Residuals obtained from the difference between observations and the two-component model. Model parameters are those of Fig. 9b. Left: residuals for 27 October. Right: residuals for 28 October. The levels are 1σ spacing with σ = 0.093 and 0.12 mJy/beam for October 27 and 28, respectively. The synthesized interferometric beam is plotted in the left corner. |
| In the text | |
|
Fig. 11 Evolution of the 250 GHz flux from IRAM 30-m telescope (red dots, Altenhoff et al. 2009) and PdBI data (black dots). PdBI 90-GHz fluxes were converted to 250 GHz fluxes, applying a conversion factor of 22.1 determined by thermal modelling. The beam size is HPBW = 11″ for the 30-m data and ~6″ for the PdBI data. The observed core (Table 7) and shell emissions on 27−28 October are shown by opened circles and triangles, respectively. The dotted-dashed line shows the model for the shell emission (q = −4, amax = 100 mm, V0 = 85 m s-1) with HPBW = 6″ for the two first dates, and 11″ later on. Two-component models (shell+core) are shown with solid, dashed and dotted lines, with the core parameters being q = −3.2 and (amax = 100 mm, V0 = 5 m s-1), (amax = 100 mm, V0 = 9 m s-1), and (amax = 10 mm, V0 = 7 m s-1), respectively. |
| In the text | |
Current usage metrics show cumulative count of Article Views (full-text article views including HTML views, PDF and ePub downloads, according to the available data) and Abstracts Views on Vision4Press platform.
Data correspond to usage on the plateform after 2015. The current usage metrics is available 48-96 hours after online publication and is updated daily on week days.
Initial download of the metrics may take a while.