Fig. 9
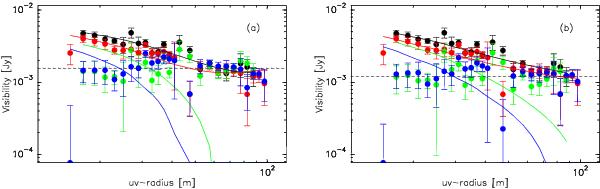
Visibility curves for the two-component model. Model curves from the shell emission and residuals (data minus shell emission) are shown by a green (blue) line and green (blue) plain circles, respectively, for 27 (28) October UT. Parameters for the shell emission are: outburst with ΔToutburst = 25 000 s, t0 = 23.8 UT, and a size distribution in a-4: a) V0 = 50 m s-1, amax = 10 mm; b) V0 = 85 m s-1, amax = 100 mm. The point source (core) emission is shown with the dashed black line. The sum of the shell and core emissions are shown in solid lines. Data are shown by filled circles with error bars. Black (red) symbols and curves are for 27 and 28 October, respectively. Dust particles are made of a porous (50% porosity) mixture of astronomical silicates and ice, with an ice mass fraction of 48%.
Current usage metrics show cumulative count of Article Views (full-text article views including HTML views, PDF and ePub downloads, according to the available data) and Abstracts Views on Vision4Press platform.
Data correspond to usage on the plateform after 2015. The current usage metrics is available 48-96 hours after online publication and is updated daily on week days.
Initial download of the metrics may take a while.