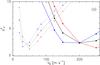
Fig. 7
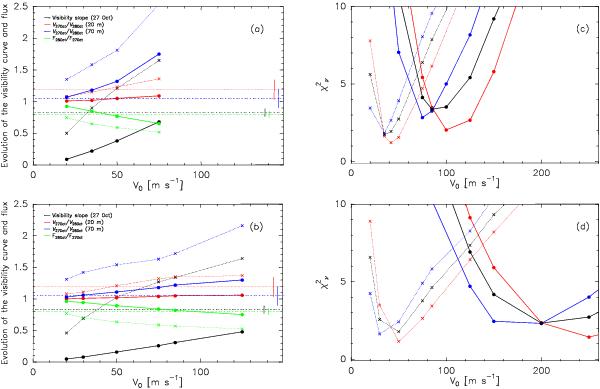
Model results as a function of dust velocity parameter V0 for astronomical silicates with 0.5 porosity and 48% ice fraction. The outburst onset is t0 = 23.8 UT and the maximum dust size is amax = 100 mm (top figures a) and c)) and amax = 1000 mm (bottom figures b) and d)). Results for size indexes of q = −3 and q = −4 are plotted respectively with solid, and dotted lines, and full circles, and crosses. Left: visibility curves and interferometric-flux characteristics:  at ruv = 20 m (red) and 70 m (blue); interferometric flux ratio F27 Oct./F28 Oct. (green); index qv of visibility curve on 27 October (black). The measured values and their error bars are shown by dotted horizontal lines, and vertical lines, respectively. Right: reduced χ2 from data fit: 27 October data (red), 28 October data (blue), 27 and 28 October data (black).
Current usage metrics show cumulative count of Article Views (full-text article views including HTML views, PDF and ePub downloads, according to the available data) and Abstracts Views on Vision4Press platform.
Data correspond to usage on the plateform after 2015. The current usage metrics is available 48-96 hours after online publication and is updated daily on week days.
Initial download of the metrics may take a while.