Fig. 11
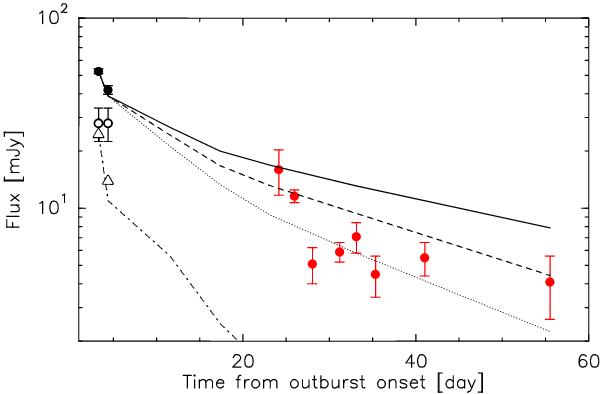
Evolution of the 250 GHz flux from IRAM 30-m telescope (red dots, Altenhoff et al. 2009) and PdBI data (black dots). PdBI 90-GHz fluxes were converted to 250 GHz fluxes, applying a conversion factor of 22.1 determined by thermal modelling. The beam size is HPBW = 11″ for the 30-m data and ~6″ for the PdBI data. The observed core (Table 7) and shell emissions on 27−28 October are shown by opened circles and triangles, respectively. The dotted-dashed line shows the model for the shell emission (q = −4, amax = 100 mm, V0 = 85 m s-1) with HPBW = 6″ for the two first dates, and 11″ later on. Two-component models (shell+core) are shown with solid, dashed and dotted lines, with the core parameters being q = −3.2 and (amax = 100 mm, V0 = 5 m s-1), (amax = 100 mm, V0 = 9 m s-1), and (amax = 10 mm, V0 = 7 m s-1), respectively.
Current usage metrics show cumulative count of Article Views (full-text article views including HTML views, PDF and ePub downloads, according to the available data) and Abstracts Views on Vision4Press platform.
Data correspond to usage on the plateform after 2015. The current usage metrics is available 48-96 hours after online publication and is updated daily on week days.
Initial download of the metrics may take a while.