Fig. 3
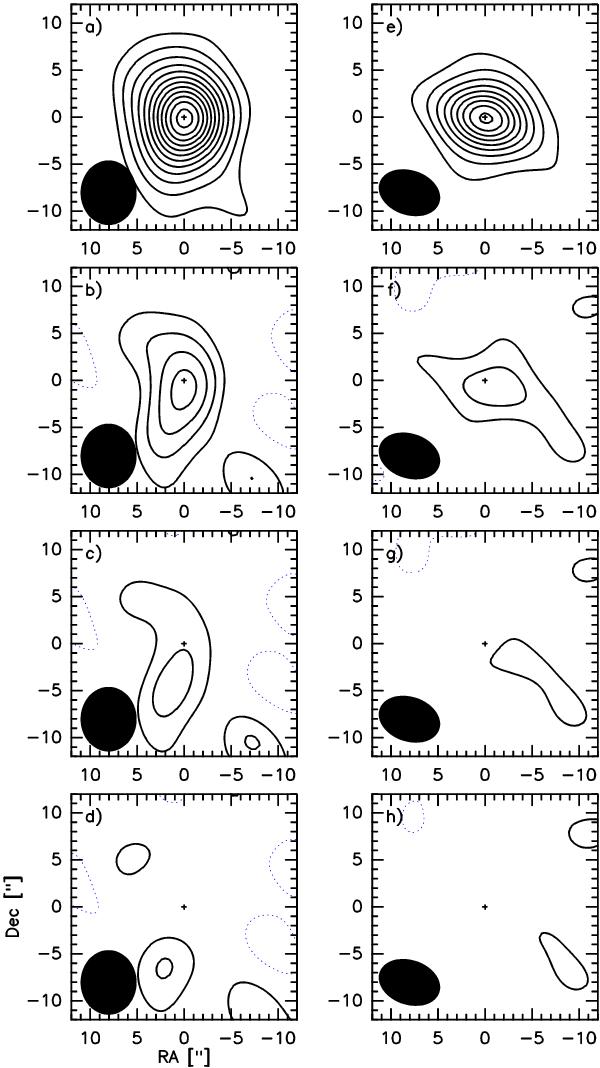
Asymmetries in the interferometric 3.3 mm maps of comet 17P/Holmes from image processing. Results for 27 and 28 October are plotted in left a)−d) and right e)−h) panels, respectively. Top figures a), e): observed images as in Fig. 2. All other figures have had a symmetric image subtracted (in the Fourier plane) to enhance azimuthal asymmetries. The symmetric images for 27 and 28 October are described by the fits of the visibilities given in Fig. 4, multiplied by a factor f equal to 0.8 b), f), 0.9 c), g), and 1.0 d), h). The interferometric beam is plotted in the bottom left corner. The level spacing is 1σ, except for the top figures (2σ, see Fig. 2), with σ = 0.093 mJy/beam for images a)−d), and σ = 0.12 mJy/beam for e)−h). Dashed contours correspond to negative fluxes.
Current usage metrics show cumulative count of Article Views (full-text article views including HTML views, PDF and ePub downloads, according to the available data) and Abstracts Views on Vision4Press platform.
Data correspond to usage on the plateform after 2015. The current usage metrics is available 48-96 hours after online publication and is updated daily on week days.
Initial download of the metrics may take a while.