Fig. 10
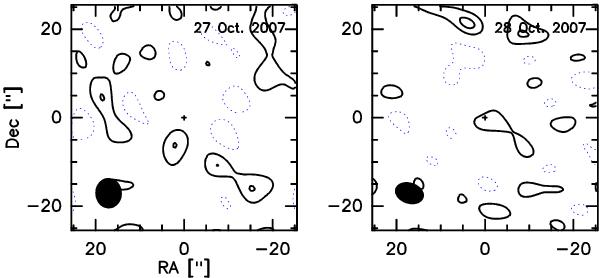
Residuals obtained from the difference between observations and the two-component model. Model parameters are those of Fig. 9b. Left: residuals for 27 October. Right: residuals for 28 October. The levels are 1σ spacing with σ = 0.093 and 0.12 mJy/beam for October 27 and 28, respectively. The synthesized interferometric beam is plotted in the left corner.
Current usage metrics show cumulative count of Article Views (full-text article views including HTML views, PDF and ePub downloads, according to the available data) and Abstracts Views on Vision4Press platform.
Data correspond to usage on the plateform after 2015. The current usage metrics is available 48-96 hours after online publication and is updated daily on week days.
Initial download of the metrics may take a while.