Fig. 2
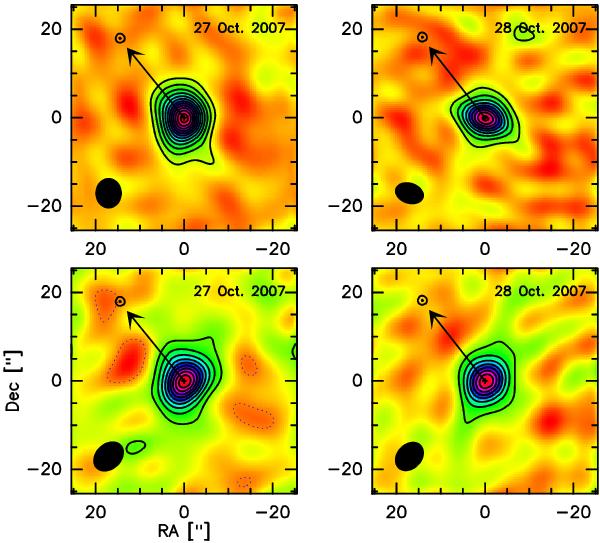
Interferometric maps of the 3.3 mm continuum emission of comet 17P/Holmes obtained on 27 and 28 October 2007 UT with PdBI. Top: full set of measurements. Bottom: maps constructed using the same uv-coverage, i.e., from data acquired with 5 antennas and between 2h00 and 7h00 UT for both dates. The interferometric beam is plotted in the bottom left corner. The maps have been centred on the position of maximum brightness. The arrow represents the Sun direction projected on the sky. The level spacing is 2σ, with σ = 0.093 (top figure) and 0.10 (bottom) mJy/beam for 27 October, and σ = 0.12 (top) and 0.14 (bottom) mJy/beam for 28 October.
Current usage metrics show cumulative count of Article Views (full-text article views including HTML views, PDF and ePub downloads, according to the available data) and Abstracts Views on Vision4Press platform.
Data correspond to usage on the plateform after 2015. The current usage metrics is available 48-96 hours after online publication and is updated daily on week days.
Initial download of the metrics may take a while.