| Issue |
A&A
Volume 539, March 2012
|
|
|---|---|---|
| Article Number | A26 | |
| Number of page(s) | 7 | |
| Section | The Sun | |
| DOI | https://doi.org/10.1051/0004-6361/201117869 | |
| Published online | 21 February 2012 | |
Coronal equatorial rotation during solar cycle 23: radial variation and connections with helioseismology
Istituto Nazionale di Astrofisica (INAF), Osservatorio Astronomico di Torino, Strada Osservatorio 20, 10025 Pino Torinese (To), Italy
e-mail: This email address is being protected from spambots. You need JavaScript enabled to view it.
Received: 10 August 2011
Accepted: 21 December 2011
Abstract
Time-series observations of the O vi 1032 Å spectral line intensity provided by the UltraViolet Coronagraph Spectrometer (UVCS) telescope aboard the Solar and Heliospheric Observatory (SOHO) spacecraft have been analyzed to establish the rotational characteristics of the equatorial solar corona as a function of height and time during solar cycle 23. Overall, the coronal rotation period is observed to vary considerably from 1996 to 2006, with episodes of sudden acceleration and deceleration. On average, the rotation period in the equatorial corona tends to increase radially by ~0.2 days/R⊙ from 1.6 to 3.0 R⊙. An anticorrelation throughout the solar cycle is observed between the radial gradients in the inner corona (≲2.2 R⊙), where the magnetic pressure dominates and the plasma is more rigidly connected, and the outer corona (≳2.4 R⊙), where the field lines open up. Around the equator, the extended corona is found to rotate faster than the underlying photosphere, but its rotation rate is comparable to that estimated within the subphotospheric layers in the outer 5% of the Sun. Moreover, a striking significant positive correlation (r = 0.629 at the 0.99 R⊙ level) has been discovered between the variations in the residual rotation rates of the coronal and subphotospheric equatorial plasma, at least down to 0.95 R⊙. This correlation suggests that the observed variations in the coronal rotation rate reflect the dynamic changes inferred within the near-surface shear layer, where the tracer structures responsible for the observed coronal emission are thus most probably anchored. These results raise the possibility that the plasma in the upper layers of the solar convection zone, at least around the equator, may be tightly connected to the plasma in the extended corona and that the deeper layers in the Sun might thus directly influence the dynamic evolution of the solar wind.
Key words: Sun: corona / Sun: rotation / Sun: UV radiation
© ESO, 2012
1. Introduction
The temporal evolution of the rotation rate in the solar corona and its variation as a function of height remains a poorly understood topic. Previous investigations have studied the coronal rotation at several wavelengths using different tracers in white light (Hansen et al. 1969; Fisher & Sime 1984; Nash 1991; Lewis et al. 1999), Fe xiv 5303 Å green line (Sime et al. 1989; Rybák 1994; Wang et al. 1997; Altrock 2003), near infrared (Insley et al. 1995), microwave (Aschwanden et al. 1995), EUV and X-ray (Timothy et al. 1975; Weber et al. 1999; Brajša et al. 2002; Karachik et al. 2006; Kariyappa 2008; Hara 2009) or through extrapolation of photospheric magnetic field data (Hoeksema & Scherrer 1987; Nash et al. 1988). With the accrual of coronagraph data from the telescopes aboard the Solar and Heliospheric Observatory (SOHO; Domingo et al. 1995) spacecraft, which allows one to probe the rotation rate of the entire solar corona, it is now possible to study the temporal variation in the coronal rotation rate for a whole solar cycle. Nonetheless, only a few attempts have been reported in the literature dealing with the measurement of the radial profile of the coronal rotation period and its time dependence. Hansen et al. (1969), from the analysis of white-light data acquired in 1967 near solar minimum conditions, found a rigid rotation rate for heights ranging from 1.1 to 2 R⊙. Parker et al. (1982), with similar observations obtained during solar cycle 20, reported instead a general increase with height in the coronal rotation rate between 1.1 and 1.5 R⊙ at low latitudes. During the solar minimum activity of cycle 23, Lewis et al. (1999), using white-light data from the Large Angle and Spectrometric Coronagraph (LASCO; Brueckner et al. 1995) C2 and C3 telescopes aboard SOHO, found a nearly constant rotation rate for heights ranging from 2.5 to 15 R⊙. Moreover, the outer corona (≳2.5 R⊙) was observed to rotate at a rate somewhat slower than the inner corona (≲2 R⊙) as inferred from LASCO C1 observations of the Fe xiv emission line. In a subsequent study, carried out from the analysis of LASCO C2 and C3 data during solar maximum conditions, Lewis & Simnett (2001) did not report any significant variation as a function of altitude within the white light corona up to 15 R⊙. Finally, Vats et al. (2001), through disk-integrated daily measurements of the solar flux in the radio band, established that the rotation rate in the equatorial region between 1.1 and 1.2 R⊙ decreased by about 2% with height during the rising phase of activity of solar cycle 23.
Recently, time-series observations of the coronal O vi 1032 Å spectral line intensity provided by the UltraViolet Coronagraph Spectrometer (UVCS/SOHO; Kohl et al. 1995) telescope onboard SOHO have been analyzed by Giordano & Mancuso (2008) and Mancuso & Giordano (2011) to study the differential rotation of the solar corona during the minimum and maximum phase of activity of solar cycle 23. Giordano & Mancuso (2008) supported the view that the observed discrepancy between the LASCO C1 and C2 observations of the rotation rates in the inner and outer corona was not an artifact caused by the different sensitivity (or systematic errors) of the two LASCO telescopes, but a real feature. Their analysis, however, was limited to a one-year period, while the radial dependence of the equatorial coronal rotation rate, as well as the coronal rotation rate itself at a selected height, might vary considerably along the solar cycle. Indeed, Mancuso & Giordano (2011), by analyzing data at 1.6 R⊙ in an interval of time around solar maximum conditions, found a systematic and consistent (up to 7%) acceleration of the equatorial coronal rotation rate.
In the present work, which follows the two previous studies of Giordano & Mancuso (2008) and Mancuso & Giordano (2011) on the rotation of the ultraviolet solar corona, we will extend the periodicity analysis to cover almost a full solar cycle, from the minimum of 1996 to the late descending phase of activity in 2006, and an interval of heights ranging from 1.6 to 3.0 R⊙. In contrast to the previous two works, however, we will restrict our analysis to the equatorial region, where the rotation rates are best established, data from higher altitudes are also available, and problems caused by projection effects (e.g., Roša et al. 1998), which might be present at higher latitudes and thus affect our analysis, are avoided. In this work, we will investigate both the radial variation of the rotation rate of the extended corona as a function of time and the relationship between the dynamics of the corona and that of the upper layers of the convection zone of the Sun as inferred by inversion of helioseismic data. The solar rotation rate indeed shows a complex variation with time, which is only partly correlated with the solar cycle (Kosovichev & Schou 1997; Howe et al. 2000a). If the magnetic tracers of the coronal rotation observed by coronagraphs such as UVCS/SOHO were anchored at some depth beneath the surface in the upper convection zone, they should somehow reflect, maybe amplified by some factor, the variations in rotation rate found there. Recently, Zaatri et al. (2009) also compared the rotation velocity of the upper subphotospheric layers obtained from ring-diagram analysis of GONG++ data with the one measured by tracing small bright coronal structures EIT/SOHO at 284 Å in the extreme ultraviolet. Their study, however, was limited to low altitudes in the corona (up to ~0.02 R⊙) and low depths in the Sun (down to ~0.02 R⊙) during a limited time period (the declining phase of activity) of solar cycle 23.
This paper is structured as follows. In Sect. 2, we present the observations and the data reduction techniques. In Sect. 3, we outline the different steps in our analysis and present our results concerning both the radial variation of the rotation rate of the equatorial corona as a function of time and the possible connection with the variations observed in the upper layers of the convection zone of the Sun. Finally, we summarize our conclusions in Sect. 4.
2. Observations and data analysis
The data used in this work were collected from April 1996 to May 2007 during regular observations of the coronal O vi 1032 Å spectral line, which is routinely observed by the UVCS/SOHO instrument. UVCS is an internally and externally occulted coronagraph consisting of two spectrometric channels for the observation of spectral lines in the UV range and a visible light channel for polarimetric measurements of the extended solar corona. The UVCS slit, parallel to a tangent to the solar limb on the plane of the sky, can be moved along the radial direction and is therefore able to yield raster observations of the solar corona between 1.4 and 10 R⊙ with a field of view of 40′. To cover all possible position angles, the slit can be rotated by 360° about an axis pointing to the Sun’s center. For a complete description of the UVCS instrument, see Kohl et al. (1995).
In the time interval of interest for this work, UVCS has been running a counterclockwise daily synoptic observation program that covered the full corona at eight different roll angles separated by an angular step of 45°. In this study, we will only consider data observed over the equatorial regions (90° and 270°) where data from altitudes up to 3 R⊙ are also available and problems owing to projection effects, which might be present at higher latitudes, are avoided. Ancillary special observations have also been included whenever the pointing was the same as the synoptic program. On average, the cadence of the data was about one per day, though unevenly spaced in time, with only a small number of gaps owing to telemetry problems or special spacecraft maneuvers. A large gap is present in the analyzed data, however, because of the accidental loss of contact with the SOHO spacecraft during the second half of 1998. Finally, starting from the year 2006, the cadence of the data falls to lower than one per day, which makes the periodicity determination more difficult.
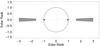 |
Fig. 1 Cartoon showing the equatorial regions (from 1.6 to 3.0 R⊙) over which the O vi 1032 Å intensity time-series have been analyzed in the solar corona (light gray areas) and the corresponding upper convection zone regions (from 0.90 to 0.99 R⊙) for which the rotation rates have been inferred from helioseismic data (dark gray areas). |
The data have been calibrated by using the most recent release of the UVCS display and analysis software1, which also takes into account the time variations of the instrument performances. All subsequent exposures with the same instrumental setup, that is, the same mirror pointing, slit width, grating position, etc., were summed up together. Because this study is focused on the analysis of the periodicities in the equatorial corona, we selected a spatial region of ~6° in latitude around the solar equator on both hemispheres and integrated the signal at each height over the whole region. Averaging over this latitude range allows one to increase the statistics without affecting the determination of the equatorial coronal rotation rate at each height because of the small latitudinal variation around the equatorial area (e.g., Giordano & Mancuso 2008). The projected areas of these regions are shown in Fig. 1, along with the range of the corresponding upper layers of the convection zone of the Sun considered in this work. To estimate the total intensity of the O vi 1032 Å spectral line from each coronal region element, the calibrated and combined UVCS spectra were fitted with a function resulting from the convolution of a Gaussian function, describing the coronal spectral profile, a Voigt curve, representing the instrumental broadening, and a function accounting for the slit width (Giordano 1998). Because the observations at a projected distance between 1.6 and 3.0 R⊙ where not taken at regular intervals of height, the daily O vi 1032 Å intensity radial scans were finally fitted with a two-component radial power law to obtain a grid of regularly spaced intensity time-series (with steps of 0.1 R⊙) between these two heights. We remark that although the synoptic program’s minimum height was set to 1.5 R⊙ from the beginning of the UVCS operations in 1996 to the end of 1999, the lowest height was raised to 1.6 R⊙ in the following years. We therefore decided to start our study from the latter height to avoid the use of extrapolated data in the periodicity analysis. Overall, the reconstructed O vi 1032 Å intensity time-series covers an interval of years ranging from mid-1996 to the end of 2006, that is, about the entire solar cycle 23, with a daily time coverage of 71% at 1.6 R⊙, 54% at 2.0 R⊙ and 48% at both 2.5 and 3.0 R⊙.
The periodicity analysis, performed through the autocorrelation function (ACF) technique, is restricted to periods on time scales near the 27-day solar rotation period and is obtained by combining results from the east and west hemispheres. The ACF technique has been extensively applied in studies of coronal rotation (e.g., Parker et al. 1982; Fisher & Sime 1984; Parker 1986; Sime et al. 1989; Lewis et al. 1999; Lewis & Simnett 2001; Vats et al. 2001; Giordano & Mancuso 2008; Chandra et al. 2009). As in Mancuso & Giordano (2011), we considered one-year time series because they represent a satisfactory compromise between time resolution, accuracy, and request of stationarity. The one-year window was then shifted by monthly steps along the full time span under study to detect possible long-term variations in the coronal rotation rate. As in the previous two works, the rotation period analysis was performed on the logarithms of the data to compress their dynamic range and reduce the impulsive effects on the time series caused by the recurrence of active region streamers. This procedure allows one to obtain a more sinusoid-like signal (Weber et al. 1999) and to stabilize the data variance (Box & Cox 1964). To remove possible long-term variations, such as the intrinsic non-stationarity of the data linked to the intensity evolution of the corona along the solar cycle and trends caused by the changing Sun-SOHO distance or uncorrected instrumental effects, each one-year time series was additionally detrended by subtracting a third-order polynomial fit from the original data. Finally, a number of outliers in our time-series data have been found to be clearly associated with emission from coronal mass ejections (CMEs) that are able to locally enhance the observed coronal UV (and specifically, the O vi) intensity up to many factors for several tens of minutes (e.g., Raymond 2002; Mancuso et al. 2002). To avoid unnecessary complications, CME-related outliers whose local contribution to the observed O vi intensity was 3σ above the mean were selectively removed from the O vi intensity time-series. A thorough description of the data reduction and analysis can be found in the previous two papers of Giordano & Mancuso (2008) and Mancuso & Giordano (2011) and will not be repeated here.
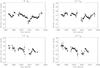 |
Fig. 2 Temporal variation of the synodic rotation period of the equatorial corona (filled circles with error bars) at four representative heights (1.6, 2.0, 2.5, and 3.0 R⊙) obtained using the autocorrelation analysis of the O vi 1032 Å spectral line intensity during the period 1996–2006. |
3. Results
The temporal evolution of the synodic rotation period of the equatorial solar corona obtained through the autocorrelation analysis of the O vi 1032 Å spectral line intensity at four representative heights (1.6, 2.0, 2.5, and 3.0 R⊙) and one-month consecutive intervals is shown in Fig. 2. Overall, the coronal rotation period is observed to vary considerably during solar cycle 23, with episodes of sudden acceleration and deceleration. Discrepancies between the data at the various heights are mostly concentrated during the minimum phase of activity (years 1996–1997), where the synodic rotation period at 3.0 R⊙ is seen to increase to almost one day with respect to the estimate obtained at lower heights, and occasionally during the maximum phase of activity (years 2000–2002). These results agree with those obtained in the two previous works dealing with shorter time windows at solar minimum (Giordano & Mancuso 2008) and maximum (Mancuso & Giordano 2011). Possible differences might be caused by different data handling and analysis techniques. We point out that, unfortunately, the period estimate is more problematic at heights above 1.6 R⊙ because of the lower signal-to-noise ratio and the diminished time coverage, which explain a few data gaps in Fig. 2 and the larger uncertainties in the resulting period estimates. The large data gap between mid-1998 and the beginning of 1999 that can be seen at all heights is instead caused by a lack of data caused by the accidental loss of contact with the SOHO spacecraft during the second half of 1998.
3.1. Comparison between coronal and subphotospheric rotation rates
As already commented by Parker et al. (1982), the observed variations in the rotation rate may reflect changes at a deeper level below the solar photosphere. If the tracers of the coronal rotation observed by UVCS/SOHO were rooted at some depth beneath the surface in the upper layers of the convection zone of the Sun (say, above ~0.90 R⊙), they should somehow reflect, maybe amplified by some factor, the variations in rotation rate found there. Alternatively, the variation in the coronal rotation rate could reflect a variation in depth of the roots of the coronal structures. To test these hypotheses, we need to know the variation of the rotation rate in the solar interior.
With helioseismology, it has now become possible to investigate the rotation rate in the solar interior for the whole solar cycle. This has been performed by inversions of the rotational splittings of the solar-oscillation frequencies from the accurately measured helioseismic data obtained by the Global Oscillation Network Group (GONG; Harvey et al. 1996) and by the Michelson Doppler Imager (MDI; Scherrer et al. 1995) onboard SOHO. Early investigations had already established that there is significant change with time of the solar interior rotation rate at a given depth (e.g., Kosovichev & Schou 1997; Schou 1999; Howe et al. 2000a; Antia & Basu 2000), with the most striking temporal variations in the form of bands with faster or slower rotation rate than the local average in the upper layers of the convection zone. In particular, at low latitudes, the zonal-flow bands appear to migrate toward the equator with time. Since data covering the whole solar cycle 23 are now available from both GONG and MDI/SOHO instruments, they can be readily used for comparison with our estimates of the coronal rotation rate to investigate a possible connection.
To facilitate comparison with the above helioseismologic studies, we converted the synodic rotation periods inferred with our analysis from units of days to frequencies and compared our estimate of the error-weighted mean of the equatorial coronal rotation rate (~464 nHz) with that of the photosphere (~452 nHz). From this we infer that the coronal rotation rate is faster by about 12 nHz. Conversely, our estimate of the rotation rate of the extended corona is comparable to the values inferred within the near-surface shear layer (the region of the Sun where the rotation rate increases with depth in the outer 5% of the solar radius), which are in a range between about 457 and 468 nHz in the equatorial region (Howe et al. 2000b). This result has important implications, because it indicates that the extended corona and the upper layers of the convection zone of the Sun rotate at about the same rate, as it would be expected if the coronal structures were anchored in the near-surface shear layer.
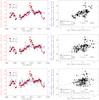 |
Fig. 3 Left: comparison between the coronal residual rotation rates at 1.6 R⊙ (red filled circles) and the solar rotation rates at three different depths below the photosphere (0.99, 0.95, and 0.90 R⊙) retrieved from GONG and MDI data (blue open squares). Right: scatter plots showing the correlation between the residual rotation rates in the corona and below the photosphere in the upper layers of the convection zone of the Sun down to 0.90 R⊙. |
To investigate this relationship in more detail, we searched for a possible correlation between coronal and subphotospheric rotation rates. To this goal, we directly compared the variations in rotation rate observed in the equatorial corona at 1.6 R⊙ with those estimated in the upper layers of the convection zone of the Sun, between 0.90 and 0.99 R⊙ (see Fig. 1), at the same latitudes. This latter information was retrieved by extracting the data from the latitude-time plots composed by combining the residuals from both GONG and MDI/SOHO observations that are made available online at the National Solar Observatory’s website (http://gong.nso.edu/). To facilitate the comparison of the two sets of (coronal and helioseismic) data, we computed the coronal rotation rate residuals by subtracting the error-weighted mean from the coronal rotation rate computed at each time. A direct comparison between the coronal residual rotation rates at 1.6 R⊙ and the solar rotation rates at three different depths below the photosphere (0.99, 0.95, and 0.90 R⊙) as retrieved from the GONG and MDI/SOHO data in the aforementioned way is shown in Fig. 3 (left panels) and depicted in different symbols and colors. By visually comparing the two sets of data, the most striking result readily emerging from Fig. 3 is that the variation in the residual rotation rate of the equatorial solar corona nicely follows the general trend of the residual rotation rate in the upper layers of the convection zone of the Sun, at least down to a depth of 0.95 R⊙. This fact is quantitatively supported by a correlation analysis that shows a statistically significant (at the 99% confidence level) positive correlation, up to r = 0.629 at 0.99 R⊙ and r = 0.525 at 0.95 R⊙. In both cases, the p-value resulting from the test of significance is < 0.010, so that the null hypothesis is rejected. Although a hint of correlation is also obtained at a level of 0.90 R⊙, it does not satisfy the above requirements for statistical significance, the resulting p-value being in this case above the chosen threshold. Scatter plots showing the correlation between the residual rotation rates in the corona and below the photosphere in the upper layers of the convection zone of the Sun down to 0.90 R⊙ are also shown in Fig. 3 (right panels). Interestingly, as can be appreciated by the different scales in the y-axes of the left panels of Fig. 3, the rotation rate variations inferred in the equatorial solar corona are amplified by about a factor of seven with respect to the fluctuations around the mean observed the upper layers of the convection zone of the Sun.
The main results emerging from this analysis are that the extended corona and the upper layers of the convection zone of the Sun rotate at about the same rate around the equator and that the dynamic changes occurring within the subphotospheric plasma are somehow directly translated (and amplified by about almost an order of magnitude) into corresponding temporal variations in the coronal rotation rate. We thus conclude that the tracer structures responsible for the observed ultraviolet emission in the extended corona are most probably anchored within the near-surface shear layer of the Sun.
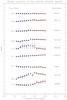 |
Fig. 4 Radial variation of the equatorial synodic period (filled circles) at nine different times (specified on the right-hand side of each series of data) during solar cycle 23. The black straight lines represent weighted linear fits to the full range of data between 1.6 and 3.0 R⊙. Blue and red straight lines represent weighted linear fits to the data between 1.6 and 2.2 R⊙ (inner corona) and 2.4 and 3.0 R⊙ (outer corona), respectively. The starting values of each series of data (that is, the rotation periods at 1.6 R⊙) are specified on the left-hand side. The ticks in the y-axis are given in daily steps. |
3.2. Radial variation of the coronal rotation period
During the solar minimum activity of cycle 23, Lewis et al. (1999), using white-light observations from the LASCO C2 and C3 telescopes in the outer corona (≳2.5 R⊙) and LASCO C1 observations of the Fe xiv emission line in the inner corona (≲2 R⊙), reported a discrepancy between the rotation rates in the two different regions, thus deducing that there must be a shear interface, at least around solar minimum, near 2–2.5 R⊙, and implying that reconnection might be taking place quasi-continuously in the high corona. This is a consequence of the fact that these two regions are, indeed, somewhat distinct: the low-latitude corona is largely comprised of closed magnetic field lines up to between 2 and 2.5 R⊙, where the magnetic pressure dominates and the plasma is more rigidly connected, while in the outer corona the field lines open up. Indeed, the height of 2.5 R⊙ also corresponds to the common location of the source surface in potential magnetic field models. As already mentioned in the introduction, Giordano & Mancuso (2008) independently confirmed this result with a set of data obtained during the same solar minimum but in a completely different wavelength band.
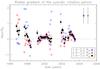 |
Fig. 5 Temporal evolution of the radial gradient of the synodic rotation period (black filled circles) of the equatorial corona with 1σ estimates of the associated uncertainties obtained by fitting the data from 1.6 to 3.0 R⊙. Blue squares and red diamonds symbols represent the radial gradients obtained by fitting the data between 1.6 and 2.2 R⊙ (inner corona) and 2.4 and 3.0 R⊙ (outer corona), respectively, as shown in Fig. 4. Representative error bars are also indicated in the upper right-hand corner. |
In Fig. 4, we show the radial variation of the synodic rotation period estimates in the equatorial corona obtained through the analysis of the time-series of the O vi 1032 Å spectral line intensity at nine representative times during solar cycle 23. Weighted linear fits to the full range of data between 1.6 and 3.0 R⊙ are also displayed with black straight lines. To investigate the temporal evolution of the coronal synodic periods observed in the equatorial region as a function of height in more detail, we also selected two different subregions, the lower one from 1.6 to 2.2 R⊙ (inner corona) and the upper one from 2.4 to 3.0 R⊙ (outer corona), additionally performing weighted linear fits to the synodic rotation periods estimated in these two subregions. The respective linear fits are displayed in Fig. 4 and depicted in blue and red straight lines. By visual inspection, it is clear that the abrupt change in rotation period that has been noticed during the solar minimum activity is not a constant feature throughout solar cycle 23. In particular, especially during solar maximum, there are many instances where the data can be nicely fitted with a single straight line between 1.6 and 3.0 R⊙, implying flat gradients of just a few tenths of a day over the whole range of heights (consider that the ticks in the y-axis of Fig. 4 are in daily steps). More quantitatively, Fig. 5 shows the temporal evolution of the radial gradient of the synodic rotation period in the equatorial corona obtained by fitting the data from 1.6 to 3.0 R⊙ (filled circles) together with 1σ estimates of the associated uncertainties. In the same plot, blue squares and red diamonds indicate the radial gradients obtained by fitting the data in the inner and outer corona, respectively, as shown in Fig. 4 for a sample of representative dates. In Fig. 5, 1σ estimates of the associated uncertainties of the data in the inner and outer corona have been omitted for clarity, but representative error bars are displayed in the upper right-hand corner of the plot. We remark that the radial gradients have been computed only when all rotation period estimates where available at each time for the entire range of heights, which explains the wide gaps in Fig. 5.
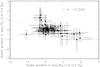 |
Fig. 6 Scatter plot of the coronal radial gradient between 1.6 and 2.2 R⊙ (inner corona) and 2.4 and 3.0 R⊙ (outer corona) showing anticorrelation. |
From the above analysis, we obtained a mean radial gradient of 0.17 ± 0.30 days/R⊙ in the extended corona, that is, on average, the rotation rate tends to decrease with height, although the observed dispersion around the mean is considerable and does not appear to be distributed at random. As for the two selected regions below and above 2.3 R⊙, we obtain, on average, 0.19 ± 0.59 days/R⊙ in the inner corona and 0.05 ± 0.48 days/R⊙ in the outer corona, although the scatter of the data around the mean is even wider in these two subregions. In these cases, the observed dispersion around the mean does not appear to be distributed at random either.
Indeed, a striking feature that can be appreciated by visually inspecting Fig. 5 is an apparent anticorrelation between the radial gradients in the two different regions below and above 2.3 R⊙ all along the solar cycle. More quantitatively, a scatter plot of the coronal radial gradient between 1.6 and 2.2 R⊙ (inner corona) and 2.4 and 3.0 R⊙ (outer corona) is shown in Fig. 6. Indeed, an anticorrelation (on the order of r ~ −0.5) can be readily appreciated in the scatter plot. The observed anticorrelation is probably related to the already mentioned distinct physical nature and configuration of the plasma in the inner and the outer corona. Indeed, the inner corona is largely comprised of closed magnetic field lines, where the magnetic pressure dominates and the plasma is more rigidly connected. On the other hand, the outer corona is mostly comprised of open, radially directed magnetic field lines, where the plasma pressure dominates.
4. Discussion and conclusions
Following a previous investigation by Giordano & Mancuso (2008) and Mancuso & Giordano (2011) on the differential rotation of the solar corona as obtained through the analysis of the intensity time series of the O vi 1032 Å spectral line observed by the UVCS/SOHO telescope, we established the rotational characteristics both in time and altitude of the solar corona. While the study in the two previous papers were based on the analysis of the coronal rotation during solar minimum and maximum conditions, the present work has extended the periodicity analysis to a wider time range, almost covering the full solar cycle 23, with an interval of altitudes ranging from 1.6 to 3.0 R⊙. Our analysis was limited to the equatorial region, where the rotation rates are best established, data from heights up to 3 R⊙ are available, and problems owing to projection effects are avoided. In our autocorrelation analysis, restricted to periodicities on time scales near the 27-day solar rotation period, we first considered the time series of the O vi intensity data in yearly pieces, determining the equatorial rotation rate within a one-year window that was shifted by monthly steps along the full time span under study.
Overall, the coronal rotation period is observed to vary considerably during solar cycle 23, with episodes of sudden acceleration and deceleration. Discrepancies between the estimated rotation periods at the various heights were mostly concentrated during the minimum phase of activity, where the synodic rotation period at 3.0 R⊙ is seen to increase to almost one day with respect to the value at lower heights, and sporadically during the maximum phase of activity. On average, the rotation period, in a range of heights from 1.6 to 3.0 R⊙ tends to increase by ~0.2 days/R⊙. A striking feature that can be observed is an anticorrelation between the radial gradients in the inner (≲2.2 R⊙) and outer ( ≳ 2.4 R⊙) corona throughout the solar cycle. This is probably related to the fact that these two regions are somewhat physically distinct, with the inner corona mostly comprised of closed magnetic field lines, where magnetic pressure dominates and the plasma is more rigidly connected, and the outer corona (say, beyond about 2.5 R⊙, that is the classical location of the source surface in potential field models of the solar corona) largely comprised of open, radially directed magnetic field lines, where the plasma pressure dominates.
By transforming the coronal synodic period temporal variations retrieved by our ACF analysis in frequencies, it has been possible to directly compare for the first time during almost a whole solar cycle the observed variations in the equatorial coronal rotation rate deduced from UVCS/SOHO observations at 1.6 R⊙ with those inferred in the upper layers of the convection zone of the Sun by combining helioseismological data collected by the GONG and MDI/SOHO instruments. The mean rotation rate of the extended corona as obtained in our analysis is faster by ~12 nHz than that of the photosphere around the equator, but comparable to the subphotospheric rotation rates found in the near-surface shear layer. Moreover, a striking correlation has been discovered between the variations in the residual rotation rates of the coronal and subphotospheric plasma, with significant correlation coefficients up to r = 0.525 at the 0.95 R⊙ level, and r = 0.629 at the 0.99 R⊙ level. The main results emerging from this comparative analysis are that the extended corona and the plasma within the near-surface shear layer of the Sun rotate at about the same rate in the equatorial region and that the dynamic changes occurring within the subphotospheric plasma are somehow directly translated (and amplified by about almost an order of magnitude) into corresponding temporal variations in the coronal rotation rate.
Recently, Zaatri et al. (2009), by comparing the sidereal angular velocity obtained from a ring-diagram analysis of GONG++ data and the one inferred from observations by EIT/SOHO at 284 Å, found that the small bright coronal structures rotate faster than the upper subphotospheric layers at the equator during the declining phase of activity of solar cycle 23. In a different study, Jurdana-Šepić et al. (2011) reported slower equatorial rotation rates of the small bright coronal structures observed in the extreme ultraviolet around the year 2002, in apparent disagreement with the results reported here. However, both above studies refer to measurements related to small coronal features that are observed by EIT/SOHO at very low coronal heights (≤1.02 R⊙), while the present paper deals with observations of UVCS/SOHO at much higher altitudes (≥1.6 R⊙), which are instead related to more extended streamer-like structures. Moreover, while the small bright coronal structures are mostly short-lived features with a lifetime up to 54 h (Brajša et al. 2008) that are formed at a height of about 8000–12 000 km (Brajša et al. 2004), our study deals with long-lived structures that persist for a few solar rotations and are up to several solar radii long. Discrepancies in the results obtained from the two coronal instruments aboard SOHO are therefore probably caused by the quite different physical nature of their respective tracers, which reflect different coronal plasma conditions.
We conclude that the tracer coronal structures responsible for the observed ultraviolet emission in the extended corona are most probably rooted within the near-surface shear layer of the Sun. These results raise the possibility that the solar plasma in the upper layers of the solar convection zone, at least around the solar equator, may be tightly connected to the plasma in the extended corona and that the deeper layers in the Sun might thus directly influence the dynamic evolution of the solar wind.
DAS 40, available at the UVCS/SOHO website http://cfa-www.harvard.edu/uvcs/
Acknowledgments
The authors would like to thank the anonymous referee, whose suggestions allowed us to significantly improve this paper. SOHO is a project of international cooperation between European Space Agency (ESA) and National Aeronautics and Space Administration (NASA), UVCS is a joint project of NASA, ASI and Swiss Funding Agencies. This work uses data obtained by the Global Oscillation Network Group (GONG) Program, managed by the National Solar Observatory, which is operated by AURA, Inc. under a cooperative agreement with the National Science Foundation.
References
- Altrock, R. C. 2003, Sol. Phys., 213, 23 [NASA ADS] [CrossRef] [Google Scholar]
- Antia, H. M., & Basu, S. 2000, ApJ, 541, 442 [NASA ADS] [CrossRef] [Google Scholar]
- Aschwanden, M. J., Lim, J., Gary, D. E., & Klimchuk, J. A. 1995, ApJ, 454, 512 [NASA ADS] [CrossRef] [Google Scholar]
- Box, G. E. P., & Cox, D. R. 1964, J. Roy. Stat. Soc. Ser. B, 26, 211 [Google Scholar]
- Brajša, R., Wöhl, H., Vršnak, B., et al. 2002, A&A, 392, 329 [NASA ADS] [CrossRef] [EDP Sciences] [Google Scholar]
- Brajša, R., Wöhl, H., Vršnak, B., et al. 2004, A&A, 414, 707 [NASA ADS] [CrossRef] [EDP Sciences] [Google Scholar]
- Brajša, R., Wöhl, H., Vršnak, B., et al. 2008, CEAB, 32, 165 [Google Scholar]
- Brueckner, G. E., Howard, R. A., Koomen, M. J., et al. 1995, Sol. Phys., 162, 357 [NASA ADS] [CrossRef] [Google Scholar]
- Chandra, S., Vats, H. O., & Iyer, K. N. 2009, MNRAS, 400, L34 [NASA ADS] [Google Scholar]
- Domingo, V., Fleck, B., & Poland, A. I. 1995, Sol. Phys., 162, 1 [NASA ADS] [CrossRef] [Google Scholar]
- Fisher, R. R., & Sime, D. G. 1984, ApJ, 287, 959 [NASA ADS] [CrossRef] [Google Scholar]
- Giordano, S. 1998, Ph.D. Thesis, Univ. Torino [Google Scholar]
- Giordano, S., & Mancuso, S. 2008, ApJ, 688, 656 [NASA ADS] [CrossRef] [Google Scholar]
- Hansen, R. T., Hansen, S. F., & Loomis, H. G. 1969, Sol. Phys., 10, 135 [NASA ADS] [CrossRef] [Google Scholar]
- Hara, H. 2009, ApJ, 697, 980 [Google Scholar]
- Harvey, J. W., Hill, F., Hubbard, R. P., et al. 1996, Science, 272, 1284 [NASA ADS] [CrossRef] [PubMed] [Google Scholar]
- Hoeksema, J. T., & Scherrer, P. H. 1987, ApJ, 318, 428 [NASA ADS] [CrossRef] [Google Scholar]
- Howe, R., Christensen-Dalsgaard, J., Hill, F., et al. 2000a, ApJ, 533, L163 [NASA ADS] [CrossRef] [Google Scholar]
- Howe, R., Christensen-Dalsgaard, J., Hill, F., et al. 2000b, Science, 287, 2456 [NASA ADS] [CrossRef] [PubMed] [Google Scholar]
- Insley, J. E., Moore, V., & Harrison, R. A. 1995, Sol. Phys., 160, 1 [NASA ADS] [CrossRef] [Google Scholar]
- Jurdana-Šepić, R., Brajša, R., Wöhl, H., et al. 2011, A&A, 534, A17 [NASA ADS] [CrossRef] [EDP Sciences] [Google Scholar]
- Karachik, N., Pevtsov, A. A., & Sattarov, I. 2006, ApJ, 642, 562 [NASA ADS] [CrossRef] [Google Scholar]
- Kariyappa, R. 2008, A&A, 488, 297 [NASA ADS] [CrossRef] [EDP Sciences] [Google Scholar]
- Kohl, J. L., Esser, R., Gardner, L. D., et al. 1995, Sol. Phys., 162, 313 [NASA ADS] [CrossRef] [Google Scholar]
- Kosovichev, A. G., & Schou, J. 1997, ApJ, 482, L20 [Google Scholar]
- Lewis, D. J., & Simnett, G. M. 2001, Sol. Phys., 200, 75 [NASA ADS] [CrossRef] [Google Scholar]
- Lewis, D. J., Simnett, G. M., Brueckner, G. E., et al. 1999, Sol. Phys., 184, 297 [NASA ADS] [CrossRef] [Google Scholar]
- Mancuso, S., & Giordano, S. 2011, ApJ, 729, 79 [NASA ADS] [CrossRef] [Google Scholar]
- Mancuso, S., Raymond, J. C., Kohl, J., et al. 2002, A&A, 383, 267 [NASA ADS] [CrossRef] [EDP Sciences] [Google Scholar]
- Nash, A. G. 1991, ApJ, 366, 592 [NASA ADS] [CrossRef] [Google Scholar]
- Nash, A. G., Sheeley, N. R., Jr., & Wang, Y. 1988, Sol. Phys., 117, 359 [NASA ADS] [CrossRef] [Google Scholar]
- Parker, G. D. 1986, Sol. Phys., 104, 333 [NASA ADS] [CrossRef] [Google Scholar]
- Parker, G. D., Hansen, R. T., & Hansen, S. F. 1982, Sol. Phys., 80, 185 [NASA ADS] [CrossRef] [Google Scholar]
- Raymond, J. C. 2002, From Solar Min to Max: Half a Solar Cycle with SOHO, ed. A. Wilson, ESA SP-508 (Noordwijk: ESA), 421 [Google Scholar]
- Roša, D., Vršnak, B., Božic, H., et al. 1998, Sol. Phys., 179, 237 [NASA ADS] [CrossRef] [Google Scholar]
- Rybák, J. 1994, Sol. Phys., 152, 161 [NASA ADS] [CrossRef] [Google Scholar]
- Scherrer, P. H., Bogart, R. S., Bush, R. I., et al. 1995, Sol. Phys., 162, 129 [Google Scholar]
- Schou, J. 1999, ApJ, 523, L181 [NASA ADS] [CrossRef] [Google Scholar]
- Sime, D. G., Fisher, R. R., & Altrock, R. C. 1989, ApJ, 336, 454 [NASA ADS] [CrossRef] [Google Scholar]
- Timothy, A. F., Krieger, A. S., & Vaiana, G. S. 1975, Sol. Phys., 42, 135 [NASA ADS] [CrossRef] [Google Scholar]
- Vats, H. O., Cecatto, J. R., Mehta, M., Sawant, H. S., & Neri, J. A. C. F. 2001, ApJ, 548, L87 [NASA ADS] [CrossRef] [Google Scholar]
- Wang, Y.-M., Sheeley, N. R., Howard, R. A., et al. 1997, ApJ, 485, 419 [NASA ADS] [CrossRef] [Google Scholar]
- Weber, M. A., Acton, L. W., Alexander, D., Kubo, S., & Hara, H. 1999, Sol. Phys., 189, 271 [NASA ADS] [CrossRef] [Google Scholar]
- Wöhl, H., Brajša, R., Hanslmeier, A., & Gissot, S. 2010, A&A, 520, A29 [NASA ADS] [CrossRef] [EDP Sciences] [Google Scholar]
- Zaatri, A., Wöhl, H., Roth, M., Corbard, T., & Brajša, R. 2009, A&A, 504, 589 [NASA ADS] [CrossRef] [EDP Sciences] [Google Scholar]
All Figures
|
Fig. 1 Cartoon showing the equatorial regions (from 1.6 to 3.0 R⊙) over which the O vi 1032 Å intensity time-series have been analyzed in the solar corona (light gray areas) and the corresponding upper convection zone regions (from 0.90 to 0.99 R⊙) for which the rotation rates have been inferred from helioseismic data (dark gray areas). |
| In the text | |
|
Fig. 2 Temporal variation of the synodic rotation period of the equatorial corona (filled circles with error bars) at four representative heights (1.6, 2.0, 2.5, and 3.0 R⊙) obtained using the autocorrelation analysis of the O vi 1032 Å spectral line intensity during the period 1996–2006. |
| In the text | |
|
Fig. 3 Left: comparison between the coronal residual rotation rates at 1.6 R⊙ (red filled circles) and the solar rotation rates at three different depths below the photosphere (0.99, 0.95, and 0.90 R⊙) retrieved from GONG and MDI data (blue open squares). Right: scatter plots showing the correlation between the residual rotation rates in the corona and below the photosphere in the upper layers of the convection zone of the Sun down to 0.90 R⊙. |
| In the text | |
|
Fig. 4 Radial variation of the equatorial synodic period (filled circles) at nine different times (specified on the right-hand side of each series of data) during solar cycle 23. The black straight lines represent weighted linear fits to the full range of data between 1.6 and 3.0 R⊙. Blue and red straight lines represent weighted linear fits to the data between 1.6 and 2.2 R⊙ (inner corona) and 2.4 and 3.0 R⊙ (outer corona), respectively. The starting values of each series of data (that is, the rotation periods at 1.6 R⊙) are specified on the left-hand side. The ticks in the y-axis are given in daily steps. |
| In the text | |
|
Fig. 5 Temporal evolution of the radial gradient of the synodic rotation period (black filled circles) of the equatorial corona with 1σ estimates of the associated uncertainties obtained by fitting the data from 1.6 to 3.0 R⊙. Blue squares and red diamonds symbols represent the radial gradients obtained by fitting the data between 1.6 and 2.2 R⊙ (inner corona) and 2.4 and 3.0 R⊙ (outer corona), respectively, as shown in Fig. 4. Representative error bars are also indicated in the upper right-hand corner. |
| In the text | |
|
Fig. 6 Scatter plot of the coronal radial gradient between 1.6 and 2.2 R⊙ (inner corona) and 2.4 and 3.0 R⊙ (outer corona) showing anticorrelation. |
| In the text | |
Current usage metrics show cumulative count of Article Views (full-text article views including HTML views, PDF and ePub downloads, according to the available data) and Abstracts Views on Vision4Press platform.
Data correspond to usage on the plateform after 2015. The current usage metrics is available 48-96 hours after online publication and is updated daily on week days.
Initial download of the metrics may take a while.