Fig. 5
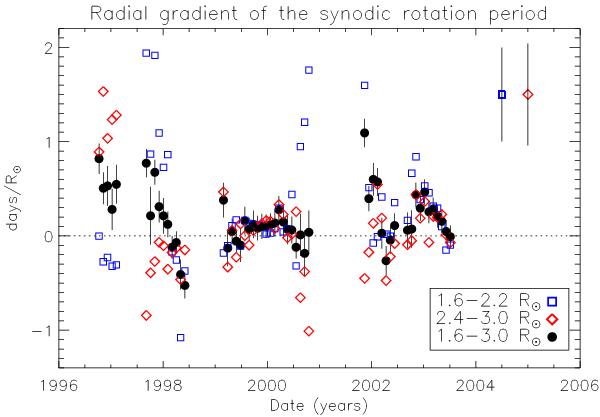
Temporal evolution of the radial gradient of the synodic rotation period (black filled circles) of the equatorial corona with 1σ estimates of the associated uncertainties obtained by fitting the data from 1.6 to 3.0 R⊙. Blue squares and red diamonds symbols represent the radial gradients obtained by fitting the data between 1.6 and 2.2 R⊙ (inner corona) and 2.4 and 3.0 R⊙ (outer corona), respectively, as shown in Fig. 4. Representative error bars are also indicated in the upper right-hand corner.
Current usage metrics show cumulative count of Article Views (full-text article views including HTML views, PDF and ePub downloads, according to the available data) and Abstracts Views on Vision4Press platform.
Data correspond to usage on the plateform after 2015. The current usage metrics is available 48-96 hours after online publication and is updated daily on week days.
Initial download of the metrics may take a while.