Fig. 4
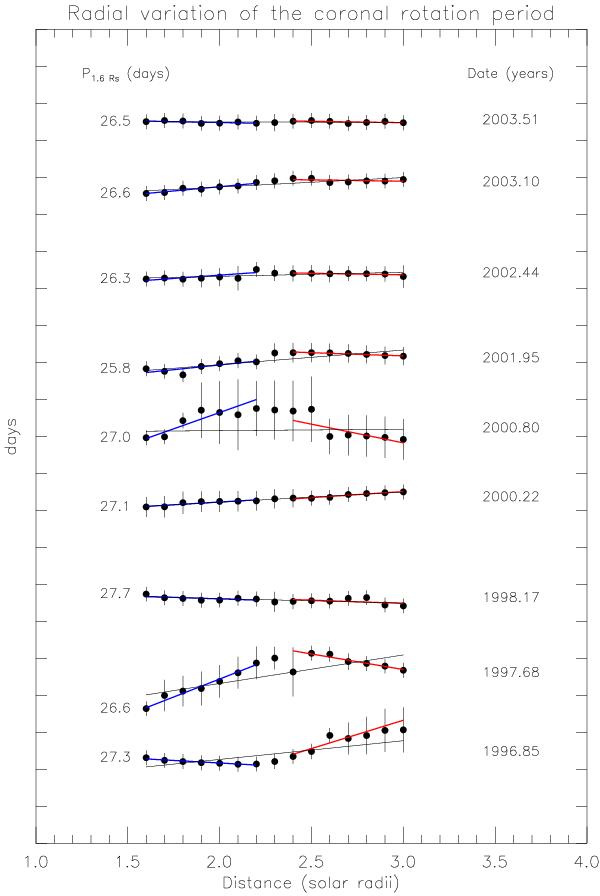
Radial variation of the equatorial synodic period (filled circles) at nine different times (specified on the right-hand side of each series of data) during solar cycle 23. The black straight lines represent weighted linear fits to the full range of data between 1.6 and 3.0 R⊙. Blue and red straight lines represent weighted linear fits to the data between 1.6 and 2.2 R⊙ (inner corona) and 2.4 and 3.0 R⊙ (outer corona), respectively. The starting values of each series of data (that is, the rotation periods at 1.6 R⊙) are specified on the left-hand side. The ticks in the y-axis are given in daily steps.
Current usage metrics show cumulative count of Article Views (full-text article views including HTML views, PDF and ePub downloads, according to the available data) and Abstracts Views on Vision4Press platform.
Data correspond to usage on the plateform after 2015. The current usage metrics is available 48-96 hours after online publication and is updated daily on week days.
Initial download of the metrics may take a while.