Fig. 3
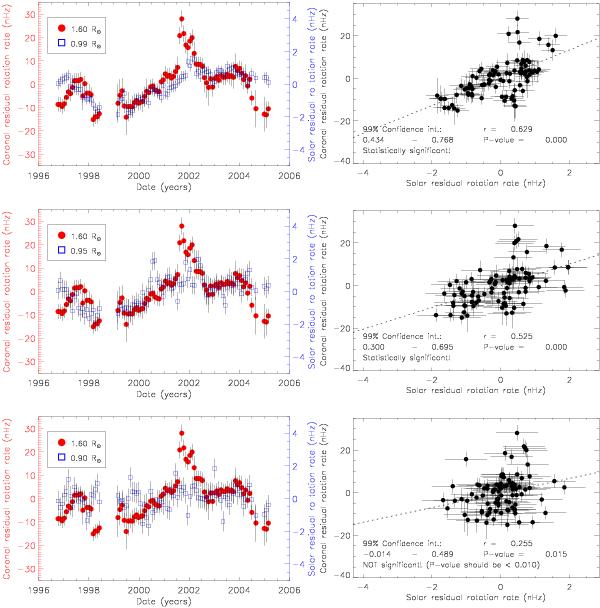
Left: comparison between the coronal residual rotation rates at 1.6 R⊙ (red filled circles) and the solar rotation rates at three different depths below the photosphere (0.99, 0.95, and 0.90 R⊙) retrieved from GONG and MDI data (blue open squares). Right: scatter plots showing the correlation between the residual rotation rates in the corona and below the photosphere in the upper layers of the convection zone of the Sun down to 0.90 R⊙.
Current usage metrics show cumulative count of Article Views (full-text article views including HTML views, PDF and ePub downloads, according to the available data) and Abstracts Views on Vision4Press platform.
Data correspond to usage on the plateform after 2015. The current usage metrics is available 48-96 hours after online publication and is updated daily on week days.
Initial download of the metrics may take a while.