Fig. 1
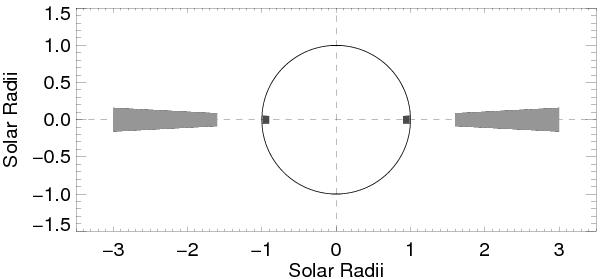
Cartoon showing the equatorial regions (from 1.6 to 3.0 R⊙) over which the O vi 1032 Å intensity time-series have been analyzed in the solar corona (light gray areas) and the corresponding upper convection zone regions (from 0.90 to 0.99 R⊙) for which the rotation rates have been inferred from helioseismic data (dark gray areas).
Current usage metrics show cumulative count of Article Views (full-text article views including HTML views, PDF and ePub downloads, according to the available data) and Abstracts Views on Vision4Press platform.
Data correspond to usage on the plateform after 2015. The current usage metrics is available 48-96 hours after online publication and is updated daily on week days.
Initial download of the metrics may take a while.