| Issue |
A&A
Volume 535, November 2011
|
|
|---|---|---|
| Article Number | A73 | |
| Number of page(s) | 11 | |
| Section | Extragalactic astronomy | |
| DOI | https://doi.org/10.1051/0004-6361/201117325 | |
| Published online | 10 November 2011 | |
Photometric AGN reverberation mapping – an efficient tool for BLR sizes, black hole masses, and host-subtracted AGN luminosities
1
Astronomisches Institut, Ruhr-Universität Bochum, Universitätsstraße 150, 44801 Bochum, Germany
e-mail: This email address is being protected from spambots. You need JavaScript enabled to view it.
2
Instituto de Astronomia, Universidad Católica del Norte, Avenida Angamos 0610, Casilla 1280 Antofagasta, Chile
Received: 23 May 2011
Accepted: 8 September 2011
Abstract
Photometric reverberation mapping employs a wide band pass to measure the AGN continuum variations and a suitable narrow band to trace the echo of an emission line in the broad line region (BLR). The narrow band catches both the emission line and the underlying continuum, and one needs to extract the pure emission line light curve. We performed a test on two local AGNs, PG0003+199 and Ark120, by observing well-sampled broad- (B, V) and narrow-band light curves with the robotic 15 cm telescope VYSOS-6 on Cerro Armazones, Chile. We find that, as long as the emission line contributes 50% to the band pass, the pure emission line light curve can be reconstructed from photometric monitoring data so that the time lag τ can be measured. For both objects the lags are consistent with spectroscopic reverberation results. We calculated virial black hole masses in agreement with literature values, by combining the BLR size RBLR (τ) from photometric monitoring with the velocity dispersion of a single contemporaneous spectrum. Applying the flux variation gradient method, we estimate the host galaxy contribution in the apertures used and the host-subtracted restframe 5100 Å luminosity LAGN. Our LAGN differs significantly from previous estimates, placing both sources ~50% closer to the RBLR − LAGN relation. This suggests that the scatter in the current RBLR − LAGN relation is largely caused by uncertainties in RBLR due to undersampled light curves and by uncertainties in the host-subtracted AGN luminosities inferred so far. If the scatter can be reduced, then two quasar samples matching in RBLR should also match in intrinsic LAGN, independent of redshift, thus offering the prospect of probing cosmological models. Photometric reverberation mapping opens the door to efficiently measuring hundreds of BLR sizes and host-subtracted AGN luminosities even with small telescopes, but also routinely with upcoming large survey telescopes like the LSST.
Key words: galaxies: nuclei / quasars: emission lines / galaxies: distances and redshifts / distance scale / dark energy
© ESO, 2011
1. Introduction
Reverberation mapping (Blandford & McKee 1982) has revolutionised our understanding of active galactic nuclei (AGN) during the past decades. Spectroscopic monitoring measures the mean time lag τ between brightness changes of the triggering optical-ultraviolet continuum (from the compact accretion disk around the black hole) and the emission line brightness echo of the broad line region (BLR) gas clouds farther out. The mean BLR size is then RBLR = τ·c, where c is the speed of light. The BLR size as measured by the centroid τcent of the cross correlation of light curves represents a luminosity-weighted average (Koratkar & Gaskell 1991; Penston 1991). Evidence exists that the BLR clouds are essentially in virialised motion around the central black hole (Peterson et al. 2004 and references therein). Combining RBLR with velocity dispersion δv of the emission line, the virial black hole mass can be estimated as MBH = fRBLRδv/G, where f is a scaling factor in the order of unity to account for the geometry of the BLR and G is the gravitational constant.
Reverberation-based BLR sizes and black hole masses have been determined so far for only about 45 low- and intermediate-luminous AGN (Wandel et al. 1999; Kaspi et al. 2000; Peterson et al. 2004; Bentz et al. 2010). Six years of reverberation mapping of six luminous high-redshift (z > 2) quasars, using the 9.2 m Hobby-Eberly-Telescope in Texas, resulted in a tentative RBLR determination of only one quasar, while the existence of pronounced variation patterns could be established in the other five sources (Kaspi et al. 2007).
Reverberation spectra usually require observations with at least a 2 m-class telescope. The BLR sizes range between a few and several hundred light days and the time spans become even longer in the observer’s frame owing to the time dilation factor 1 + z. To match distinct echo features, light curves from over a few months to several years are needed. Consequently, spectroscopic reverberation mapping is resource expensive and becomes prohibitive at high redshift. Therefore, more efficient observing strategies are desired.
Another topic with respect to the BLR size – AGN luminosity relationship is to determine the pure AGN luminosity, free of host galaxy contributions. While high spatial resolution images have been invoked to model and subtract the host contribution from the total fluxes (e.g. Bentz et al. 2009), the flux variation gradient method (Choloniewski 1981) provides an efficient approach, which we inspect here as well.
We here revisit photometric reverberation mapping. It employs wide pass bands to trace the AGN continuum and suitable narrow bands to trace the echo of the BLR lines. The advantage is that photometric monitoring can be obtained both more quickly and with small telescopes. Furthermore, while long-slit spectroscopic monitoring allows for simultaneous measurement of typically one or two calibration stars placed accurately on the spectrograph slit, one may expect that the large number of non-variable calibration stars on the same images and of similar brightness as the AGN facilitates high-precision photometric monitoring.
About 40 years ago, narrow-band AGN monitoring of emission lines was performed, for instance for NGC 3516 and NGC 4151 (Cherepashchuk & Lyutyi 1973). Despite the coarse (>10 days) time sampling, these observations discovered a lag between Hα and the continuum of 25 and 30 days for NGC 3516 and NGC 4151, respectively. However, spectroscopic monitoring with better time sampling finds a lag of 13 ± 4 days for NGC 3516 (Peterson et al. 2004) and 6.6 ± 1.1 days for NGC 4151 (Bentz et al. 2006). The discrepancy between the photometrically and spectroscopically determined lags is most likely due to insufficient time sampling of the early photometric monitoring.
To explore the capability and achievable accuracy of photometric reverberation mapping, we selected two local AGNs, the relatively clear-cut case PG0003+199 (Mrk 335) at redshift z = 0.0258 and the more challenging case Ark 120 at z = 0.0327. Spectroscopic reverberation results are available for comparison (Peterson et al. 1998a, 2004).
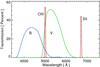 |
Fig. 1 Effective transmission of the filters convolved with the quantum efficiency of the ALTA U16M CCD camera. |
2. Data
We performed a monitoring campaign between August 2009 and March 2010 using the robotic 15 cm telescope VYSOS-6 of the Universitätssternwarte Bochum on Cerro Armazones, the future location of the ESO Extremely Large Telescope in Chile. VYSOS-6 is equipped with a 4096 × 4096 pixel CCD yielding a field-of-view of 2.7°, and seven broad- and narrow-band filters1.
We obtained light curves with a median sampling of two days in the B-band (Johnson, 4330 ± 500 Å), the redshifted Hα (NB 6721 ± 30 Å at z = 0.0258) and Hβ lines (NB 5007 ± 30 Å at z = 0.0327). For Ark 120 we also obtained a light curve in the V-band (Johnson, 5500 ± 500 Å). In addition, we observed PG0003+199 in both B and V on July 25, 2010 and June 26, 2011. Figure 1 shows the effective transmission of the filters used here. To perform absolute photometric calibration, each night we observed standard stars in the fields SA092, SA095, SA111 from Landoldt (2009). For both targets, a single contemporaneous spectrum was obtained with CAFOS at the 2.2 m telescope on Calar Alto, Spain, with a slit width of 154.
We reduced all data in a standard manner, using IRAF and custom written tools. Because the flux calibration using the standard star fields introduces additional errors into the light curves, we created relative light curves (in normalised flux units) using 20–30 non-variable stars located on the same images within 30 around the AGN and with a similar brightness to the AGN. For analysing time lags we used the mean and standard deviation of these relative light curves. For the photometric analysis (to obtain the AGN luminosities), we kept the shape of the mean light curves fixed and calibrated them by a least-squares fit to the photometry derived from the standard star fields.
Source parameters and photometry results are summarised in Table 1. Photometry is obtained using apertures of 78 for PG0003+199 and 75 for Ark120. For the monitoring campaigns the photometry range is indicated by the double arrow. The photometry errors of 2–4% for individual measurements are determined from the scatter caused by ~10 different calibration stars from Landolt (2009). To apply the flux variation gradient method, the photometry is corrected for galactic foreground extinction and converted to mJy, with results listed as fBextcorr and fVextcorr. Values used to correct for galactic extinction are: PG0003+199: AB = 0.153 mag, AV = 0.118 mag; Ark120: AB = 0.554 mag, AV = 0.426 mag (Schlegel et al. 1998). For the conversion from mag to mJy, zero mag fluxes of 4266.7 Jy in B and 3836.3 Jy in V are used.
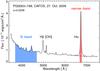 |
Fig. 2 Observed spectrum of PG0003+199. The B-band (blue shaded) traces essentially the AGN continuum, while the narrow-band (red shaded) is dominated by the Hα line. The blue and red shaded areas are a schematic illustration, and quantitative calculations were made using the transmission curves shown in Fig. 1. |
Source parameters and photometry results.
3. Results
3.1. Results for PG0003+199
PG0003+199 is essentially a point-like, low-luminosity quasar (Narrow Line Seyfert-1) without a bright extended host. The Hα line is strong and well covered by the narrow-band filter. This makes PG0003+199 a clear-cut test case.
3.1.1. Spectrum
Figure 2 shows the spectrum of PG0003+199. The contribution of higher order Balmer lines (and that of the host galaxy) to the B-band is negligible, thus the B-band is dominated by the AGN continuum. When taking the spectral resolution into account, the observed Hα line dispersion σ = 1300 km s-1 reduces to an intrinsic value σ = 870 km s-1. The narrow-band filter effectively covers the line between velocities − 2800 km s-1 and + 1800 km s-1, so that at least 95% of the line flux is contained in the pass band, as we determined after line profile deconvolution.
The contribution of both the [N II] 6583 Å and narrow-line Hα flux is predicted to be less than 40% of the [O III] 5007 Å emission (Bennert et al. 2006), hence negligible (<10%). The continuum underneath the emission line is small, contributing to only 15% of the total flux in the band pass, therefore the narrow-band light curves will be dominated by the Hα echo of the BLR gas clouds. Comparison with simulated line profiles of echo models (Welsh & Horne 1991; Horne et al. 2004) ascertains that the 5% line flux outside the band pass only has a marginal effect (<2%) on the BLR size determination: the narrow-band echo may miss only a small fraction (<20%) of the innermost part of the BLR, namely the part that exhibits the fastest line-of-sight velocity, while the innermost gas clouds moving closer along the sky plane exhibit a modest line-of-sight velocity and are therefore contained in the narrow-band.
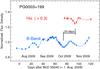 |
Fig. 3 B-band and Hα light curves of PG0003+199. The Hα observations were started in October 2009 after recognising the pronounced B-band variations. |
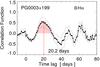 |
Fig. 4 Cross correlation of the B and Hα light curves of PG0003+199, taking all data points. The dotted lines indicate the error range ( ± 1σ) around the cross correlation. The red shaded area marks the range to calculate the centroid τcent of the major correlation feature, yielding a lag of 20.2 days (vertical dashed line). |
3.1.2. Light curves and BLR size
Figure 3 depicts the light curves of PG0003+199. The AGN continuum as traced by the B-band increases gradually from August 2009 to a peak around the end of September, followed by a steep trough by 20% at MJD ~ 55 118 (=55045 + 73). Also the Hα light curve has a steep ~10% trough with a delay of about 20 days.
We used the discrete correlation function (DCF, Edelson & Krolik 1988) to cross correlate the Hα and B-band light curves. The cross correlation shows a major peak with a lag of 20.2 days as defined by the centroid τcent (Fig. 4). Two smaller correlation peaks around lag 50 days and 65 days are present, and are caused by the B-band troughs at the beginning and middle of September 2009 (Fig. 3). We do not consider these two lags further here, because spectroscopic reverberation predicts a lag of less than 30 days (Peterson et al. 2004).
To determine the lag uncertainty, we applied the flux randomization and random subset selection method (FR/RSS, Peterson et al. 1998b). From the observed light curves we created 2000 randomly selected subset light curves, each containing 63% of the original data points, and randomly altering the flux value of each data point consistent with its (normal-distributed) measurement error. Then we cross correlated the 2000 pairs of subset light curves and computed the centroid τcent. Figure 5 shows the distribution of the 2000 τcent values, which yields the median lag τcent and the 68% confidence range. From this distribution we obtain a lag  days. Thus, the mean of positive and negative uncertainty of τcent is about 12% (2.4/20.5)2. Correcting for the time dilation (factor 1 + z at z = 0.0258) yields a rest frame lag of 20.0
  days.
days.
We did not find any Hα lags of PG0003+199 in the literature, but we can compare our result with that of the Hβ line for which spectroscopic reverberation mapping found a rest-frame lag of 15.7 ± 3.7 days averaged over several epochs (Peterson et al. 2004; Bentz et al. 2009). This Hβ lag is ~30% smaller than our Hα lag of 20.0 days. One possible explanation could be that the BLR size is smaller for higher excitation emission lines. Kaspi et al. (2000) found in the spectroscopic reverberation data of 17 PG quasars RHα = sRHβ with a scaling factor s = 1.19, but a high uncertainty of ± 0.23. On the other hand, Kollatschny (2003a) provides clear evidence for the BLR stratification of Mrk 110 (s = 1.37, his Table 1). Recently, the Lick AGN Monitoring Program of 11 low-luminosity AGN found s = 1.54 ± 0.4 (Bentz et al. 2010). It could be that the BLR stratification and the scaling factor s depends on the luminosity. The luminosity of PG0003+199 is similar to that of Mrk 110. If the value s = 1.37 of Mrk 110 holds for PG0003+199, then the Hβ lag of PG0003+199 translates to an Hα lag of 15.7 × 1.37 = 21.5 days, hence agrees within 8% with the restframe Hα lag of 20.0 days from our measurement.
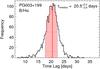 |
Fig. 5 Result of the FR/RSS error analysis of the cross correlation of the B and Hα light curves of PG0003+199. The histogram shows the distribution of τcent for 2000 flux randomised and randomly selected subset light curves. The median of this distribution is taken as the final value of the lag τcent. The red shaded area marks the 68% confidence range used to calculate the errors of τcent. |
3.1.3. Black hole mass
Next we try to determine the mass of the central black hole. While spectroscopic reverberation data enable one to use the velocity information from the rms spectra, i.e. from the variable portion of the emission lines, several attempts have been made to determine the mass of the central black hole using single epoch spectra (e.g. Vestergaard 2002; Woo et al. 2007; Denney et al. 2009a). In this way the reported uncertainties of the velocity dispersion range between 15% and 25%. For PG0003+199 combining the intrinsic line dispersion from our single spectrum (870 km s-1, with 25% uncertainty adopted) and the time delay (20.0 ± 2.4 days) yields a virial black hole mass MBH = 2.8 ± 1.1 × 10⁶M⊙, in agreement with the value of 2.8 ± 0.8 × 10⁶ M⊙ derived via spectroscopic reverberation mapping by Peterson et al. (2004).
3.1.4. Host-subtracted AGN luminosity
To determine the AGN luminosity free of host galaxy contributions, we applied the flux variation gradient (FVG) method proposed by Choloniewski (1981). In this method the B and V data points obtained in the same night through the same apertures are plotted in a B-flux versus V-flux diagram. Fluxes (e.g. in units of mJy) are plotted and not magitudes. The important feature is that the flux variations follow a linear relation with a slope ΓBV given by the host-free AGN continuum (e.g. Choloniewski 1981; Winkler et al. 1992; Winkler 1997).
In the flux-flux diagram the host galaxy – including the contribution of line emission from the narrow line region (NLR) – lies on the AGN slope somewhere toward its fainter end. This has been demonstrated for a sample of 11 nearby AGN (neither containing PG0003+199 nor Ark120) by Sakata et al. (2010), using monitoring data in combination with Hubble Space Telescope (HST) and multi-band ground-based images from the MAGNUM telescope. For an 83 aperture, they derived host galaxy colours in the range 0.8 < B − V < 1.1 (their Table 6), which agree with the typical colours of a bulge or an elliptical galaxy. This colour range corresponds to a host slope in the range  . The contribution of the NLR emission lines to the B and V bands is less than 10% of the host flux and has a similar colour as the host galaxy (cf. Tables 6 and 8 of Sakata et al. 2010). We note that dust enshrouded nuclear starbursts, which often accompany the AGN phenomenon, have red colours (B − V ~ 1). They would be unresolved on HST images and could explain the small deviations of the host position from the AGN slope found in three cases by Sakata et al. (2010). Therefore, by host we here denote the host galaxy including NLR AGN lines and starbursts.
The host slopes pass through the origin. Because the host slopes are flatter than typical AGN slopes (ΓBV ~ 1), the intersection of the two slopes should occur in a well defined range. Winkler et al. (1992) showed for NGC 3783 that this intersection range allows one to determine the host flux contribution and to calculate a host-subtracted AGN luminosity at the time of the monitoring campaign – even without the need for high spatial resolution images. Next (and in Sect. 3.2.4) we test this procedure on our data. Table 2 summarises the results of the FVG diagnostics, which are derived as follows.
Parameters derived from the flux variation gradient method (FVG).
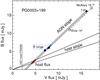 |
Fig. 6 B versus V fluxes of PG0003+199, measured in a 78 aperture (black dots). Errors are within the size of the symbols. A linear least-squares fit to the three data points yields the range for the AGN slope plotted by the two steep lines. This slope is corroborated by the slope (dashed line) obtained with larger apertures 14 (Elvis) and 157 (McAlary). The range of host slopes plotted by the two shallow lines is taken from Sakata et al. (2010). The intersection area of the AGN and host slopes (red shaded) defines the host contribution. The blue shaded area marks the intersection of the AGN slope with the range of B fluxes during our Aug.–Nov. 2009 monitoring campaign. This area allows us to infer the range of V fluxes during the monitoring campaign. The vertical dotted line marks the host flux found in an aperture of via modelling of HST F550M images by Bentz et al. (2009). All data are corrected for galactic foreground extinction. |
During our monitoring campaign of PG0003+199 in August through November 2009, we obtained only B fluxes, but we have three data points at hand for the B versus V flux-flux diagram as shown in Fig. 6. All data are corrected for galactic foreground extinction (Table 1). That PG0003+199 was much brighter in 1979 (McAlary et al. 1983) than in 2009–2011 allows us to achieve a linear least-squares fit to the data points with sufficient accuracy. The fit yields an AGN slope ΓBV = 1.20 ± 0.04. This slope is at the steep end, but within the range determined by Winkler et al. (1992) for other type-1 AGN.
To check the slope of PG0003+199 further, we searched in the NASA Extragalactic Database (NED) and found two more B and V data points taken with comparable apertures, one with 157 by McAlary et al. (1983) and one with 140 by Elvis et al. (1994). These (extinction corrected) data points are displaced to the right of the 78 slope in Fig. 6, because they contain additional host emission from the extended disk which is redder than the AGN emission. These two data points yield a slope of ΓBV = 1.25 ± 0.04. The consistency of ΓBV derived from two independent data sets corroborates the steep AGN slope of PG0003+199.
The range of host slopes () is taken from Sakata et al. (2010). The intersection area of the AGN and host slopes defines the host flux. Averaging over the intersection area yields a mean host flux of 2.16 ± 0.29 mJy in B and 4.56 ± 0.30 mJy in V.
During our monitoring campaign, the total B fluxes lie in the range between 5.69 mJy and 6.78 mJy with a mean of 6.24 ± 0.31 mJy. To derive the contemporaneous 5100 Å AGN luminosity, which is widely used in reverberation studies, we tried to extrapolate the host-subtracted B fluxes to restframe 5100 Å fluxes, using a power-law spectral shape (Fν ∝ να) with α constrained by ΓBV. But this extrapolation results in large uncertainties, because α is sensitive to errors in ΓBV. Therefore we applied the following procedure, inferring the V flux range in a first step.
During our monitoring campaign, the V fluxes should lie in the intersection area of the B flux range with the AGN slope (Fig. 6). That the data point from June 2011 lies in this area supports our suggestion. From this area we infer the V fluxes during the monitoring campaign, yielding a mean fV = 7.95 ± 0.31 mJy.
Then, during our monitoring campaign the host-subtracted AGN fluxes are in the range 4.08 ± 0.43 mJy in B and 3.39 ± 0.40 mJy in V. From this range we interpolate the host-subtracted AGN flux of PG0003+199 at restframe 5100 Å F5100 = 3.52 ± 0.41 mJy, adopting for the interpolation that the AGN has a power-law spectral energy distribution (Fν ∝ να). To determine the errors on F5100, we interpolated F5100 between fB + σ and fV + σ as well as between fB − σ and fV − σ. At the distance of 112.6 Mpc this yields a host-subtracted AGN luminosity L5100 = 3.13 ± 0.36 × 1043 erg s-1. The 12% uncertainty includes the measurement errors, the uncertainty of the AGN and host slopes, and the AGN variations.
The AGN luminosity during our campaign derived with the FVG method is about a factor of two lower than the value L5100 = 6.03 ± 0.03 × 1043 erg s-1 derived with host galaxy modelling by Bentz et al. (2009) for the data of the spectroscopic monitoring campaign (Peterson et al. 1998a). To understand this difference, we compared the numbers given in Bentz et al. (their Tables 7–9) with ours. Our aperture area ( in diameter) is only 25% larger than that of Peterson’s campaign (), and the additional flux from the outer region is negligible (Fig. 3 in Bentz et al. 2009). The total observed (not extinction corrected) fluxes F5100 are similar at 7.83 × 10⁻¹⁵ erg s-1 cm for our campaign and 7.68 − 8.81 × 10⁻¹⁵ erg s-1 cm
 for Peterson’s campaign. The main difference, however, lies in the estimate of the host contribution. Already in the early stage of the HST image decomposition with GALFIT, the Bentz et al. host flux (fVhost ~ F550M = 1.88 × 10⁻¹⁵ erg s-1 cm
 ) corresponds after extinction correction to 2.12 mJy, which is more than a factor two smaller than our fVhost = 4.56 mJy.
As illustrated in Fig. 6, it is hard to bring the small host flux from GALFIT modelling into agreement with the available FVG data. Firstly, we consider whether the discrepancy may be caused by failures in the FVG method. We find that 1) altering the assumptions on the host slope does not bring the host contributions into agreement; 2) although the AGN slope is determined by only a few data points, the wide flux range, which allows for a good slope determination, and the consistency between the AGN slope determined with apertures of 78 and ~15 argues in favour of a steep AGN slope; 3) the correction for galactic foreground extinction may introduce errors in the AGN slope. However, the foreground extinction is relatively low (Table 1), and even without correcting for foreground extinction, the AGN slope remains steep (ΓBV = 1.16 ± 0.05), resulting in fVhost = 4.2 ± 0.3 mJy, hence about twice the GALFIT host value; 4) if the host flux from GALFIT modelling were correct, then at low luminosity the AGN slope (of PG0003+199) would show a strong curvature towards redder colours, contradicting the results by Sakata et al. (2010) where the host galaxy lies on the linear extension of the AGN slope. These four arguments lead us to conclude that the discrepancy between GALFIT and FVG host fluxes is not caused by errors in the FVG method alone. On the other hand, looking for potential error sources in the GALFIT method, it could be that a large fraction of the bulge and/or nuclear starbursts of PG0003+199 is unresolved on the HST images and therefore underestimated by the GALFIT modelling. Future data may clarify this issue.
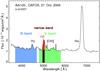 |
Fig. 7 Observed spectrum of Ark 120. The B-band (blue shaded) traces the AGN (and host) continuum and a small (<5%) contribution by Hγ. The V-band (green shaded) traces the continuum and a small (<15%) contribution by Hβ. The narrow-band traces the continuum (black shaded) and Hβ (red shaded), each component contributing to about 50% to the band pass. The red wing of Hβ extending beyond [OIII] is neither seen in Hα nor in Hγ and could be due to Fe lines (Korista 1992). For the effective transmission curves of B and V see Fig. 1. |
3.2. Results on Ark 120
3.2.1. Implications from the spectrum
Ark120 lies at redshift z = 0.0327 so that the Hβ line falls into the NB 5007 ± 30 Å filter. Compared to the case of PG0003+199, the observations of Ark 120 are more challenging: first, compared to Hα, the Hβ line is fainter contributing only to ~50% of the flux in the NB band pass (Fig. 7). To measure the continuum variations underneath the Hβ line, light curves using neighbouring off-line intermediate bands would be ideal, but such bands were not available. While the V-band covers Hβ and the Fe complex, it is dominated to 83% ± 3% by the AGN and host continuum (calculated using the transmission curve of filter and CCD shown in Fig. 1), so we used the V-band, in addition to B-band and NB 5007 Å. The second challenge is that (after accounting for the spectral resolution) the Hβ line is broader than the narrow band pass, so that the broadest line wings, carrying about 10–15% of the line flux, escape detection in the NB. Despite these handicaps, the results are promising.
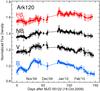 |
Fig. 8 Light curves of Ark 120 between October 2009 and March 2010. The B, V, and NB curves are as observed, the Hβ curve is computed by subtracting a scaled V curve from the NB curve (Hβ = NB − 0.5 V) and re-normalisation (mean = 1). For better visibility, the light curves are shifted against each other by + 0.2. The 2009 December data are mostly lost by strong wind preventing us from opening the dome. |
3.2.2. Light curves and BLR size
Figure 8 depicts the light curves of Ark 120. The dense time sampling clearly outlines the variations. The B-band steeply increases during ten days in November 2009 by about 17% with a sharp peak at the end of November 2009. From January to March 2010 it declines gradually by about 17%. In November the V and NB light curves are similar to that of the B-band, but with smaller amplitude (V ~ 10%, NB ~ 7%). In contrast to the steep B band flux increase, the NB flux increase is stretched until January 2010 with an amplitude of 12–15% between the beginning of November and January. The possible influence of the missing data in December 2009 is discussed in Sect. 4.
The NB contains about 50% continuum and 50% Hβ (Fig. 7). To remove the continuum, we computed a synthetic Hβ light curve by subtracting a scaled V curve from the NB curve: Hβ = NB − 0.5 V (V scaling factor = 0.5). Alternating the V scaling factors between 0.4 and 0.6 yields similar results. The synthetic Hβ curve still has a remaining variability pattern in October and November, which we suggest arises from the relicts of the continuum. However, the important result is that compared to November, the ~10% higher flux level in January becomes more pronounced. While the subtraction of a scaled V curve from the NB curve turns out to be a successful approach to recovering a pure Hβ light curve, we discuss potential refinements in Sect. 4.
Figure 9 shows the cross correlation results after applying the DCF to the entire light curves in a first step. The DCF of B and NB exhibits two distinct major peaks, one at a lag of 47.5 days and one at a lag of about zero days. Because the cross correlation of B and V yields a lag of 1.2 days consistent with lag zero, we conclude that the lag zero peak in the DCF of B and NB comes from the continuum contribution contained in the NB. This contribution appears here in autocorrelation, while the lag of 47.5 days is due to the line echo. This is corroborated further by the DCF of the B and synthetic Hβ curves, where the peak at lag 47.7 days dominates, while the continuum-caused contribution at lag zero is very reduced. This shows that the subtraction of a scaled V light curve from the narrow-band light curve, in fact, largely removes the interfering continuum emission, allowing us to measure the lag of the emission line.
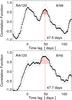 |
Fig. 9 Cross correlations of Ark 120 light curves for B and NB, and for B and the synthetic Hβ (=NB − 0.5 V). The dotted lines indicate the error range ( ± 1σ) around the cross correlation. The red shaded area marks the range used to calculate the lag τcent (vertical dashed line). |
To determine the lag uncertainties, we applied the FR/RSS method, again creating 2000 randomly selected subset light curves, each containing 63% of the original data points, and randomly altering the flux value of each data point consistent with its (normal-distributed) measurement error. Then we cross-correlated the 2000 pairs of subset light curves and computed the centroid τcent. As shown in Fig. 10, the resulting median lag is  days for the DCF of B and NB, and
  days for the DCF of B and synthetic Hβ. Briefly, the lag uncertainty is about 7%. Correcting 48.0 days for the time dilation factor (1.0327) we obtain a rest frame lag of 46.5 ± 3.25 days, consistent with the lag found by spectroscopic monitoring (47 ± 10 days by Peterson et al. 1998a, 2004; and in the range 34–54 days by Doroshenko et al. 1999).
3.2.3. Black hole mass
From our single epoch spectrum we determined an intrinsic Hβ line dispersion of σ = 1950 km s-1, in agreement with the value by Peterson et al. (2004). To get rid of the red wing of the Hβ line, we mirrored the blue side of the Hβ line profile to the red, and calculated the line dispersion of this synthetic profile. The shape and the dispersion of this profile are consistent with what we derived for Hα (σ ~ 1970 km s-1) and Hγ (σ ~ 1920 km s-1). Combining line dispersion (with 25% uncertainty adopted) and the time delay (46.5 ± 3.25 days) yields a virial MBH = 34 ± 12 × 106 M⊙, consistent with the value of 35 ± 8 × 10⁶ M⊙ derived via spectroscopic reverberation mapping by Peterson et al. (2004).
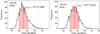 |
Fig. 10 FR/RSS cross correlation results of Ark 120. left: B and NB, right: B and synthetic Hβ. Each histogram shows the distribution of τcent obtained by cross-correlating 2000 flux randomised and randomly selected subset light curves. The median of this distribution is taken as lag τcent. The red shaded area marks the 68% confidence range used to calculate the errors of τcent. |
Already in the 1970s and 1980s, numerous studies revealed that the Hβ line profile of Ark120 is strongly variable and exhibits two peaks in the rms spectra and a prominent red wing, which is present neither in Hα nor in Hγ (Fig. 7). As discussed by Doroshenko et al. (1999), the BLR of Ark120 may show accretion inflows in addition to the virialised motion, and therefore any black hole mass estimates should be considered with some reservation.
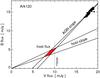 |
Fig. 11 B versus V fluxes of Ark 120, measured in a 7.5 aperture. The fluxes for each night (fat dots) follow a linear gradient yielding the range for the AGN slope. As host slope we adopted the range found by Sakata et al. (2010). The intersection of the two slopes (red shaded area) defines the host flux. The vertical dotted line marks the host flux found in an aperture of via modelling of HST F550M images by Bentz et al. (2009). All data are corrected for galactic foreground extinction. |
3.2.4. Host-subtracted AGN luminosity
To separate AGN and host luminosity contributions, we applied the flux variation gradient method (Choloniewski 1981). Figure 11 shows the B versus V fluxes of Ark 120, corrected for galactic foreground extinction (Schlegel et al. 1998). Table 2 summarises the results. A linear least-squares fit to the flux variations yields ΓBV = 1.19 ± 0.06, consistent with the ΓBV = 1.20 ± 0.10 found by Winkler et al. (1992, using 20 aperture and adopting EB − V = 0.1) and with the ΓBV = 1.22 ± 0.02 found by Doroshenko et al. (2008, after correcting the values in their Table 3 for extinction. Because of a typo the value V = 14.27 mag in this table should be V = 14.72 mag to be consistent with the plotted values in their Fig. 4). The range of host slopes is taken from Sakata et al. (2010). The intersection area of the AGN and host slopes defines the host contribution. Averaging over the intersection area yields a mean host flux of fB = 4.26 ± 0.59 mJy and fV = 9.02 ± 0.62 mJy. Our host fluxes (in a 75 aperture) are consistent, albeit a bit high, when compared with the values fB ≈ 4.5 mJy and fV ≈ 9 mJy (in a 15 aperture) from a FVG analysis of UBVRI data (Doroshenko et al. 2008). Subtracting our host fluxes from the total fluxes, we obtain the host-subtracted B and V fluxes and then by power-law interpolation the rest-frame AGN flux f5100 = 9.41 ± 0.86 mJy. At the distance of 141.8 Mpc, this yields a host-subtracted AGN luminosity L5100 = 13.27 ± 1.21 × 1043 erg s-1. The uncertainty of the AGN luminosity is less than 10%.
The AGN luminosity during our campaign as derived with the FVG method is about 50% higher than the mean value L5100 = 8.47 ± 0.81 × 1043 erg s-1 derived with host galaxy modelling by Bentz et al. (2009) for the data of the spectroscopic monitoring campaign (Peterson et al. 1998a). A detailed comparison of the parameters yields an aperture area ( in diameter) that is only 16% larger than that of Peterson’s campaign (), and the V band host fluxes agree within the uncertainties as shown in Fig. 11 (extinction-corrected: fV ≈ 9 mJy from our data and F550M ≈ 10 mJy from the HST/spectroscopic data base). However, the total observed (not extinction corrected) fluxes F5100 differ significantly at 13.4 × 10⁻¹⁵ erg s-1 cm for our campaign and lying in the range 7.82 − 10.37 × 10⁻¹⁵ erg s-1 cm during Peterson’s eight-year campaign, hence are 30–70% larger in our campaign. This leads us to conclude that the AGN luminosity is ~50% higher during our campaign.
4. Discussion
The tests on PG0003+199 and Ark120 demonstrate the feasibility of photometric reverberation mapping to measure the BLR size. The case of Ark120 demonstrates that the continuum contribution (~50%) to the narrow-band NB can be successfully estimated and corrected (Hβ = NB – 0.5 V), while the uncorrected cross correlation (B/NB) shows two distinct peaks, one from the autocorrelation of the continuum and one from the emission line at lag τcent consistent with the literature data. In the case of Ark120, it turns out that the host contribution to the V band is 50% and the AGN+host continuum contribution to the NB is about 50%, too. Therefore, this coincidence makes the V scaling factor of 0.5 to work well. The general procedure of recovering a pure Hβ light curve, depends on the AGN/host contrast CAGN/host in the filters used and the AGN/line ratio CAGN/line in the NB. Thus, a proper treatment of the relevant filter light curves would be to
-
Remove the constant host emission from the light curves. To this end, estimate the host contribution in each filter, for instance via FVG analysis. Subtract the host contribution from the light curves. Now the (renormalised) light curves measure the AGN continuum and in the NB also the line emission.
-
Extract the line light curve from the NB light curve. To this end, estimate the AGN continuum contribution to the NB, for instance from a spectrum also taking aperture differences into account. Then, using a suitable filter next to the NB, e.g. V for Hβ, subtract the AGN continuum light curve from the NB light curve.
We now discuss the accuracies achieved for the two objects, the importance of good time sampling, and the improvement potential for the RBLR − L relationship. The BLR sizes determined by photometric monitoring agree within a few percent with those from spectroscopic reverberation mapping. The RBLR measurement accuracy we derived from the FR/RSS method is 12% for the short light curve of PG0003+199 and 7% for the longer monitored Ark120, while the uncertainty of the black hole mass (~35%) is mainly due to the adopted 25% uncertainty of the velocity dispersion from single-epoch spectra.
Our RBLR measurement accuracy appears exceptionally high compared with typical RBLR errors (~30%) reported so far from spectroscopic reverberation data. Adopting that the determination of the emission line lag via spectroscopic monitoring is more precise than via photometric monitoring, the difference in the error ranges may be explained by two effects. Firstly, compared to our photometric campaign, most of the available spectroscopic campaigns were performed with a lower sampling rate, but over longer time spans. Thus they catch several variability events and implicitly determine an average lag. Then the reported errors include not only the formal measurement errors, but also the possible scatter of the intrinsic lags. On the other hand, a low sampling rate might limit the potential to reach small errors. Then our high RBLR measurement accuracy might be favoured by the high sampling rate (median 2 days) of the light curves.
To check the influence of the sampling rate on the errors, we performed the following test. From the entire light curves of Ark120 we created three regular subsets with a median sampling of 4, 8, and 16 days and determined for each subset τcent and its errors using the FR/RSS analysis. It turns out that poorer sampling results in substantially increased errors. Even worse, for the poorest data set (sampled with median 16 days) τcent could not be recovered. The reason is that the two cross-correlation peaks seen in Fig. 9 were no longer separated. Therefore, to quantify the error dependence from the sampling, we applied a constraint in FR/RSS analysis. We excluded those τcent values outside the range 30–70 days. This enables us to determine τcent even in the poorly sampled data set. The result of this procedure is shown in Fig. 12. The test confirms that the sampling rate plays a crucial role in achieving small errors. More important, if the continuum contributes significantly to the narrow-band, then photometric reverberation mapping requires well sampled light curves, because otherwise the cross correlation may fail to disentangle the line echo from the autocorrelated continuum contribution.
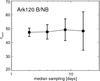 |
Fig. 12 Dependence of τcent and its errors on the median sampling. |
We caution that the formal errors from the FR/RSS analysis do not account for potential systematic errors caused, for instance, by gaps in the observed light curves. We illustrate this with the light curves of Ark120. Despite the dense median sampling of the light curves by two days, the light curves of Ark120 have a gap of 18 days in December 2009 (Fig. 8). While the continuum brightening occurred in November, the line brightening, as far as we can see it, is delayed to January 2010, yielding the measured lag of τcent ~ 48 days. However, because of the observational gap we do not know whether the line brightening already occurred in December 2009. To test the effect, if there were a strong line echo in December 2009, we took the B and NB light curves and filled the gap with the artificial bump in the NB light curve as shown in Fig. 13. The bump may be somewhat strong, but it was chosen to better illustrate the potential effects here. One can already see in the light curves that the lag between the B band increase in November and the NB increase in December is about 30 days. The cross correlation of these artificial light curves shows two major peaks, one from the autocorrelated continuum at lag zero and one from the line at lag 31 days (Fig. 14). The FR/RSS analysis yields  days. The difference between this lag and τcent = 48 days derived from the original light curves is 18 days which is just about the size of the gap. From this example we conclude that, if there is a large observational gap, one should take a potential systematic error of τcent into account, which is about the size of the gap. In this example the light curve is short in the sense that it covers only one pronounced continnum event and one subsequent line echo. Therefore the missing information during the gap cannot be filled. But in long-lasting light curves that cover several variability events one may expect that the actual gaps are smaller on average. These considerations about systematic errors hold for both photometric and spectroscopic reverberation data. Therefore, they do not question the successful applicability of photometric reverberation mapping.
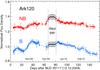 |
Fig. 13 Artificial B and NB light curves of Ark120, with additional data points (black dots) filling the observational gap of 18 days end of December 2009. The data points are chosen so that they mimic a strong line echo during the gap. |
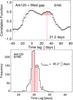 |
Fig. 14 Top: cross correlation of the complemented B and NB light curves of Ark 120 shown in Fig. 13. The dotted lines indicate the error range ( ± 1σ) around the cross correlation. Bottom: distribution and 68% confidence range of τcent, obtained by FR/RSS analysis. |
Reverberation mapping, in general, relies on the time resolution, and therefore it is vital that the light curves are sufficiently well sampled. Recalling Nyquist’s Theorem, the sampling rate SR of the feature of interest, i.e. the lag, must be SR = tlag/tsampling > 2.2. In the observational practice, data points are lost from poor weather or technical problems, so one should aim at SR > 3. So far, however, many BLR sizes have been derived from sparsely sampled light curves (SR < 3) with a limited potential of reaching better than 30% accuracy. It could be that, for undersampled data, any quoted uncertainties of 30% are too optimistic. For example, the recent spectroscopic reverberation campaign with improved daily sampling on NGC 4051 revealed that its BLR size is actually a factor of ~ 3 smaller than inferred from earlier undersampled data (Denney et al. 2009b). Therefore, we suggest that some more of the BLR size measurements can be improved with well-sampled reverberation data.
Applying the flux variation gradient (FVG) method to B and V band data and adopting a host colour range determined for other local AGN, we find that for both objects PG0003+199 and Ark120 the host-subtracted AGN luminosity L5100 differs significantly from previous measurements. While for PG0003+199 we find a stronger host contribution leading to 50% lower AGN luminosity, for Ark120 our host estimate is consistent with others, but the AGN was in a 50% brighter state during our campaign. The AGN/host luminosity contrast of both objects is relatively low, LAGN/Lhost ~ 1 for the 7 − 8 apertures used. The uncertainties of L5100 are 9% and 12% in Ark120 and PG0003+199. These uncertainties include the measurement errors, the AGN variations and the uncertainty of the host flux. For LAGN/Lhost ~ 1, the errors are dominated by the uncertainty of the host flux. It depends on the error of the AGN slope and the range adopted for the host slope. If improved image quality allows us to use smaller photometric apertures containing less host flux, the uncertainty caused by the range of host slopes may be reduced. Also, applying the FVG method to more than one filter pair, for instance from UBVRI monitoring data, allows one to construct several independent AGN slopes and thus to determine the host contribution in a consistent manner, largely independent of the adopted range of host slopes. For powerful AGN with LAGN/Lhost > 2, the uncertainty of the host contribution plays a minor role.
An important result from spectroscopic reverberation mapping is the relationship between the BLR size and the nuclear luminosity RBLR ∝ Lα with a predicted slope of α = 0.5 (Netzer 1990; Netzer & Marziani 2010). This relationship allows one to derive the virial black hole mass for high-redshift AGN from single-epoch spectra by inferring RBLR from L (e.g. Vestergaard 2002; Netzer 2003; McLure & Dunlop 2004). While early observations indicated α = 0.6 ± 0.1 (Kaspi et al. 2000, 2005), for Hβ line and 5100 Å luminosity a recent analysis including host galaxy subtraction yields α = 0.519 ± 0.063 (Bentz et al. 2009). The slope of the current RBLR − L relationship depends on the adopted cosmology, because the more luminous sources are at higher redshift than the low-luminosity AGN.
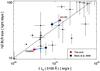 |
Fig. 15 RBLR versus L, from Bentz et al. (2009). Shown is a zoomed portion containing the two sources PG0003+199 and Ark120. For PG0003+199 we used RHβ = RHα/1.37 (Sect. 3.1.2). The new measurements shift both objects clearly outside the range of the previous errors bars and about a factor 2 closer to the dashed line that is the fit with a slope α = 0.519 obtained by Bentz et al. (2009). |
The current RBLR − L relationship exhibits a large scatter over an order of magnitude in both RBLR and L, and many objects have large error bars (Fig. 15). The new photometric reverberation measurements shift the position of PG0003+199 and Ark120 in this diagram outside the quoted error range of the previous positions. Notably, the shift is higher in L than in RBLR. The new positions are about 50% closer to the relationship fitted by Bentz et al. (Fig. 15). This suggests that well-sampled reverberation data and improved host-free AGN luminosities may significantly reduce the scatter of the RBLR − L relationship. Certainly, a true scatter may remain, simply because AGN are complicated objects and the RBLR determination depends on the continuum variability pattern and the geometry of the BLR that produces the line echo. Future data will show how far the scatter can be reduced.
5. Outlook
While spectroscopic reverberation mapping is the only way to explore the details of the innermost AGN structure and the geometry of the BLR (e.g. Kollatschny 2003a,b; Kollatschny & Zetzl 2010), the advantage of photometric reverberation mapping with suitable filters is to efficiently measure BLR sizes and host-subtracted luminosities for large AGN and quasar samples – even with small telescopes. Photometric broad- and narrow-band monitoring of a sample of 100 quasars (V < 18 mag) can be performed with 1-m telescopes in an equivalent to three years observing time.
In the case of Ark120, the Hβ line contributes to only 50% of the flux in the narrow band pass we used. This suggests that photometric reverberation mapping of emission line lags works even for broader bands, as long as the line contributes at least 50% to the band pass. Also, it is worthwhile testing the method even for weaker emission lines contributing less than 50% to the band pass. The upcoming Large Synoptic Survey Telescope (LSST) is equipped with six broad band filters and will discover thousands of variable AGN. The Hα line is shifted into the i′ and z′ bands at z ≈ 0.16 and z ≈ 0.38, respectively, and may be strong enough to contribute about 50% to these broad bands. While an approximate photometric redshift may be sufficient to determine the filter that contains the Hα line, it is desirable to take a spectrum of the AGN, in order to measure an accurate redshift, also for luminosity determination, and the line dispersion for black hole mass estimates. To determine the Hα line lag, the neighbouring filters, which are largely free of line emission, may be used to interpolate and remove the continuum variations underneath the Hα line, much like what we did for Ark120. Recently, an interesting statistical alternative to our method has been proposed by Chelouche & Daniel (2011), which is specifically designed for large samples of AGN light curves expected to be obtained with the LSST. Consider AGN light curves in two band passes, curve X (tracing the continuum largely free of emission lines) and curve Y (tracing the emission line with underlying continuum): while our approach aimed to remove the continuum contribution from curve Y by subtracting a scaled X curve, Chelouche & Daniel propose to use the light curves X and Y unchanged, and to subtract the autocorrelation of X from the cross correlation of X and Y, in order to determine the line lag. Numerical simulations with synthetic AGN light curves and the treatment of four archival PG quasar light curves yield lags that are (in three out of four cases) consistent with spectroscopic results. However, the reported lag uncertainties of individual AGN are large (~50%), and only for averages of large ensembles of several hundred AGN does the obtained lag appear satisfying. Future optimisations, which combine our approach with that of Chelouche & Daniel, would be intriguing.
Finally we outline a modification of the proposals by Elvis & Karovska (2002) and Horne et al. (2003) for determining quasar distances from reverberation data, hence probing dark energy. The luminosity difference between the open Einstein – de Sitter cosmology (ΩM = 0.2,ΩΛ = 0) and the concordance cosmology (ΩM = 0.3,ΩΛ = 0.7) is 20%–30% at redshift 0.4 < z < 0.8 (Riess et al. 1998). From the RBLR − L relationship we conclude that two quasar samples with the same RBLR distribution, one sample at low redshift and one sample at high redshift, should have the same intrinsic L distribution. Thus one may constrain the luminosity for different cosmologies by measuring the BLR size and the host-subtracted brightness of quasar samples at different redshifts. If for objects matching in RBLR the true scatter in L can be reduced to about a factor 2 (=200%), the mean luminosity of 1000 quasars may be determined with a statistical accuracy of 200%/ %, enabling a 3σ–5σ detection of a cosmological 20–30% luminosity difference.
Since August 2010, VYSOS-6 consists of two 15 cm telescopes on the same mount, equipped with 14 broad- and narrow-band filters.
The observed Hα light curve has only 10 data points, 3 of which are in the trough. While a subset of exactly 63% data points would require to take 6.3 data points, we selected 7 random data points. This ~10% larger number of data points may bias the errors to somewhat lower values. On the other hand, we find the largest errors for those randomly selected subset light curves where all 3 data points in the trough are omitted. In this case the information about the existence of a trough is completely lost. To counterbalance this effect, we selected 7 instead of 6.3 data points.
Acknowledgments
This work was supported by the Nordrhein-Westfälische Akademie der Wissenschaften und der Künste, funded by the Federal State Nordrhein-Westfalen and the Federal Republic of Germany, as well as by the CONICYT GEMINI National programme fund 32090025 for the development of Astronomy and related Sciences. We thank the director of the Calar Alto Observatory, David Barrado, for allocating discretionary time and Uli Thiele and Manuel Alises for observing the spectra. The observations on Cerro Armazones benefitted from the care of the guardians Hector Labra, Gerard Pino, Alberto Lavin, and Francisco Arraya. Special thanks go to Roland Lemke for his invaluable technical support, and to the anonymous referee for his constructive critical report. This research made use of the NASA/IPAC Extragalactic Database (NED) which is operated by the Jet Propulsion Laboratory, California Institute of Technology, under contract with the National Aeronautics and Space Administration.
References
- Bennert, N., Jungwiert, B., Komossa, S., Haas, M., & Chini, R. 2006, A&A, 459, 55 [NASA ADS] [CrossRef] [EDP Sciences] [Google Scholar]
- Bentz, M. C., Denney, K. D., Cackett, E. M., et al. 2006, ApJ, 651, 775 [NASA ADS] [CrossRef] [Google Scholar]
- Bentz, M. C., Peterson, B. M., Netzer, H., Pogge, R. W., & Vestergaard, M. 2009, ApJ, 697, 160 [Google Scholar]
- Bentz, M. C., Walsh, J. L., Barth, A. J., et al. 2010, ApJ, 716, 993 [NASA ADS] [CrossRef] [Google Scholar]
- Blandford, R. D., & McKee, C. F. 1982, ApJ, 255, 419 [NASA ADS] [CrossRef] [EDP Sciences] [Google Scholar]
- Chelouche, D., & Daniel, E. 2011 [arXiv:1105.5312v1] [Google Scholar]
- Cherepashchuk, A. M., & Lyutyi, V. M. 1973, Ap. Lett., 13, 165 [Google Scholar]
- Choloniewski, J. 1981, Acta Astron., 31, 293 [NASA ADS] [Google Scholar]
- Denney, K. D., Peterson, B. M., Dietrich, M., Vestergaard, M., & Bentz, M. C. 2009a, ApJ, 692, 246 [NASA ADS] [CrossRef] [Google Scholar]
- Denney, K. D., Watson, L. C., Peterson, B. M., et al. 2009b, ApJ, 702, 1353 [NASA ADS] [CrossRef] [Google Scholar]
- Doroshenko, V. T., Sergeev, S. G., Pronik, V. I., & Chuvaev, K. K. 1999, Astron. Lett., 25, 569 [Google Scholar]
- Doroshenko, V. T., Sergeev, S. G., & Pronik, V. I. 2008, Astron. Rep., 52, 167 [NASA ADS] [CrossRef] [Google Scholar]
- Edelson, R. A., & Krolik, J. H. 1988, ApJ, 333, 646 [NASA ADS] [CrossRef] [Google Scholar]
- Elvis, M., & Karovska, M. 2002, ApJ, 581, L67 [NASA ADS] [CrossRef] [Google Scholar]
- Elvis, M., Wilkes, B. J., McDowell, J. C., et al. 1994, ApJS, 95, 1 [NASA ADS] [CrossRef] [Google Scholar]
- Horne, K., Korista, K. T., & Goad, M. R. 2003, MNRAS, 339, 367 [NASA ADS] [CrossRef] [Google Scholar]
- Horne, K., Peterson, B. M., Collier, S. J., & Netzer, H. 2004, PASP, 116, 465 [NASA ADS] [CrossRef] [Google Scholar]
- Kaspi, S., Smith, P. S., Netzer, H., et al. 2000, ApJ, 533, 631 [NASA ADS] [CrossRef] [Google Scholar]
- Kaspi, S., Maoz, D., Netzer, H., et al. 2005, ApJ, 629, 61 [NASA ADS] [CrossRef] [Google Scholar]
- Kaspi, S., Brandt, W. N., Maoz, D., et al. 2007, ApJ, 659, 997 [NASA ADS] [CrossRef] [Google Scholar]
- Kollatschny, W. 2003a, A&A, 407, 461 [NASA ADS] [CrossRef] [EDP Sciences] [Google Scholar]
- Kollatschny, W. 2003b, A&A, 412, L61 [NASA ADS] [CrossRef] [EDP Sciences] [Google Scholar]
- Kollatschny, W., & Zetzl, M. 2011, Nature, 470, L366 [NASA ADS] [CrossRef] [Google Scholar]
- Koratkar, A. P., & Gaskell, C. M. 1991, ApJS, 75, 719 [NASA ADS] [CrossRef] [Google Scholar]
- Korista, K. T. 1992, ApJS, 79, 285 [Google Scholar]
- Landolt, A. U. 2009, AJ, 137, 4186 [NASA ADS] [CrossRef] [Google Scholar]
- McAlary, C. W., McLaren, R. A., & McGonegal, R. J. 1983, ApJS, 52, 341 [NASA ADS] [CrossRef] [Google Scholar]
- McLure, R. J., & Dunlop, J. S. 2004, MNRAS, 352, 1390 [NASA ADS] [CrossRef] [Google Scholar]
- Netzer, H. 1990, in Active Galactic Nuclei, ed. Courvoisier, & Mayor (Spinger), 57 [Google Scholar]
- Netzer, H. 2003, ApJ, 583, L5 [NASA ADS] [CrossRef] [Google Scholar]
- Netzer, H., & Marziani, P. 2010, ApJ, 724, 318 [NASA ADS] [CrossRef] [Google Scholar]
- Penston, M. V. 1991, in Variability of Active Galactic Nuclei, ed. H. R. Miller, & P. J. Wiita (Cambridge: Cambridge University Press), 343 [Google Scholar]
- Peterson, B. M., Wanders, I., Bertram, R., et al. 1998a, ApJ, 501, 82 [NASA ADS] [CrossRef] [Google Scholar]
- Peterson, B. M., Wanders, I., Horne, K., et al. 1998b, PASP, 110, 660 [NASA ADS] [CrossRef] [Google Scholar]
- Peterson, B. M., Ferrarese, L., Gilbert, K. M., et al. 2004, ApJ, 613, 682 [NASA ADS] [CrossRef] [Google Scholar]
- Riess, A. G., Filippenko, A. V., Challis, P., et al. 1998, AJ, 116, 1009 [NASA ADS] [CrossRef] [Google Scholar]
- Sakata, Yu, Minezaki, T., Yoshii, Y., et al. 2010, ApJ, 711, 461 [NASA ADS] [CrossRef] [Google Scholar]
- Schlegel, D. J., Finkbeiner, D. P., & Davis, M. 1998, ApJ, 500, 525 [NASA ADS] [CrossRef] [Google Scholar]
- Vestergaard, M. 2002, ApJ, 571, 733 [NASA ADS] [CrossRef] [Google Scholar]
- Wandel, A., Peterson, B. M., & Malkan, M. A. 1999, ApJ, 526, 579 [NASA ADS] [CrossRef] [Google Scholar]
- Welsh, W., & Horne, K. 1991, ApJ, 379, 586 [NASA ADS] [CrossRef] [Google Scholar]
- Winkler, H. 1997, MNRAS, 292, 273 [NASA ADS] [CrossRef] [Google Scholar]
- Winkler, H., Glass, I. S., van Wyk, F., et al. 1992, MNRAS, 257, 659 [NASA ADS] [Google Scholar]
- Woo, J.-H., Treu, T., Malkan, M. A., Ferry, M. A., & Misch, T. 2007, ApJ, 661, 60 [NASA ADS] [CrossRef] [Google Scholar]
All Tables
All Figures
|
Fig. 1 Effective transmission of the filters convolved with the quantum efficiency of the ALTA U16M CCD camera. |
| In the text | |
|
Fig. 2 Observed spectrum of PG0003+199. The B-band (blue shaded) traces essentially the AGN continuum, while the narrow-band (red shaded) is dominated by the Hα line. The blue and red shaded areas are a schematic illustration, and quantitative calculations were made using the transmission curves shown in Fig. 1. |
| In the text | |
|
Fig. 3 B-band and Hα light curves of PG0003+199. The Hα observations were started in October 2009 after recognising the pronounced B-band variations. |
| In the text | |
|
Fig. 4 Cross correlation of the B and Hα light curves of PG0003+199, taking all data points. The dotted lines indicate the error range ( ± 1σ) around the cross correlation. The red shaded area marks the range to calculate the centroid τcent of the major correlation feature, yielding a lag of 20.2 days (vertical dashed line). |
| In the text | |
|
Fig. 5 Result of the FR/RSS error analysis of the cross correlation of the B and Hα light curves of PG0003+199. The histogram shows the distribution of τcent for 2000 flux randomised and randomly selected subset light curves. The median of this distribution is taken as the final value of the lag τcent. The red shaded area marks the 68% confidence range used to calculate the errors of τcent. |
| In the text | |
|
Fig. 6 B versus V fluxes of PG0003+199, measured in a 78 aperture (black dots). Errors are within the size of the symbols. A linear least-squares fit to the three data points yields the range for the AGN slope plotted by the two steep lines. This slope is corroborated by the slope (dashed line) obtained with larger apertures 14 (Elvis) and 157 (McAlary). The range of host slopes plotted by the two shallow lines is taken from Sakata et al. (2010). The intersection area of the AGN and host slopes (red shaded) defines the host contribution. The blue shaded area marks the intersection of the AGN slope with the range of B fluxes during our Aug.–Nov. 2009 monitoring campaign. This area allows us to infer the range of V fluxes during the monitoring campaign. The vertical dotted line marks the host flux found in an aperture of via modelling of HST F550M images by Bentz et al. (2009). All data are corrected for galactic foreground extinction. |
| In the text | |
|
Fig. 7 Observed spectrum of Ark 120. The B-band (blue shaded) traces the AGN (and host) continuum and a small (<5%) contribution by Hγ. The V-band (green shaded) traces the continuum and a small (<15%) contribution by Hβ. The narrow-band traces the continuum (black shaded) and Hβ (red shaded), each component contributing to about 50% to the band pass. The red wing of Hβ extending beyond [OIII] is neither seen in Hα nor in Hγ and could be due to Fe lines (Korista 1992). For the effective transmission curves of B and V see Fig. 1. |
| In the text | |
|
Fig. 8 Light curves of Ark 120 between October 2009 and March 2010. The B, V, and NB curves are as observed, the Hβ curve is computed by subtracting a scaled V curve from the NB curve (Hβ = NB − 0.5 V) and re-normalisation (mean = 1). For better visibility, the light curves are shifted against each other by + 0.2. The 2009 December data are mostly lost by strong wind preventing us from opening the dome. |
| In the text | |
|
Fig. 9 Cross correlations of Ark 120 light curves for B and NB, and for B and the synthetic Hβ (=NB − 0.5 V). The dotted lines indicate the error range ( ± 1σ) around the cross correlation. The red shaded area marks the range used to calculate the lag τcent (vertical dashed line). |
| In the text | |
|
Fig. 10 FR/RSS cross correlation results of Ark 120. left: B and NB, right: B and synthetic Hβ. Each histogram shows the distribution of τcent obtained by cross-correlating 2000 flux randomised and randomly selected subset light curves. The median of this distribution is taken as lag τcent. The red shaded area marks the 68% confidence range used to calculate the errors of τcent. |
| In the text | |
|
Fig. 11 B versus V fluxes of Ark 120, measured in a 7.5 aperture. The fluxes for each night (fat dots) follow a linear gradient yielding the range for the AGN slope. As host slope we adopted the range found by Sakata et al. (2010). The intersection of the two slopes (red shaded area) defines the host flux. The vertical dotted line marks the host flux found in an aperture of via modelling of HST F550M images by Bentz et al. (2009). All data are corrected for galactic foreground extinction. |
| In the text | |
|
Fig. 12 Dependence of τcent and its errors on the median sampling. |
| In the text | |
|
Fig. 13 Artificial B and NB light curves of Ark120, with additional data points (black dots) filling the observational gap of 18 days end of December 2009. The data points are chosen so that they mimic a strong line echo during the gap. |
| In the text | |
|
Fig. 14 Top: cross correlation of the complemented B and NB light curves of Ark 120 shown in Fig. 13. The dotted lines indicate the error range ( ± 1σ) around the cross correlation. Bottom: distribution and 68% confidence range of τcent, obtained by FR/RSS analysis. |
| In the text | |
|
Fig. 15 RBLR versus L, from Bentz et al. (2009). Shown is a zoomed portion containing the two sources PG0003+199 and Ark120. For PG0003+199 we used RHβ = RHα/1.37 (Sect. 3.1.2). The new measurements shift both objects clearly outside the range of the previous errors bars and about a factor 2 closer to the dashed line that is the fit with a slope α = 0.519 obtained by Bentz et al. (2009). |
| In the text | |
Current usage metrics show cumulative count of Article Views (full-text article views including HTML views, PDF and ePub downloads, according to the available data) and Abstracts Views on Vision4Press platform.
Data correspond to usage on the plateform after 2015. The current usage metrics is available 48-96 hours after online publication and is updated daily on week days.
Initial download of the metrics may take a while.