Fig. 8
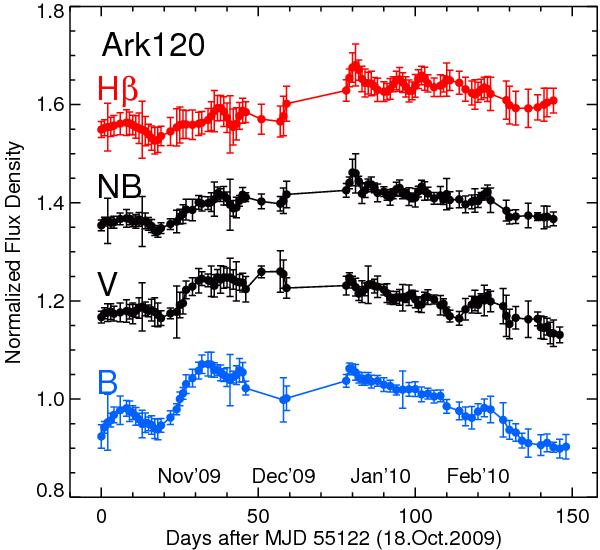
Light curves of Ark 120 between October 2009 and March 2010. The B, V, and NB curves are as observed, the Hβ curve is computed by subtracting a scaled V curve from the NB curve (Hβ = NB − 0.5 V) and re-normalisation (mean = 1). For better visibility, the light curves are shifted against each other by + 0.2. The 2009 December data are mostly lost by strong wind preventing us from opening the dome.
Current usage metrics show cumulative count of Article Views (full-text article views including HTML views, PDF and ePub downloads, according to the available data) and Abstracts Views on Vision4Press platform.
Data correspond to usage on the plateform after 2015. The current usage metrics is available 48-96 hours after online publication and is updated daily on week days.
Initial download of the metrics may take a while.