Fig. 6
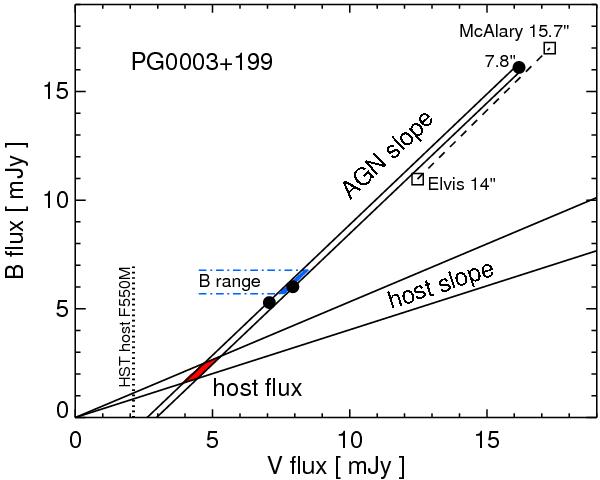
B versus V fluxes of PG0003+199, measured in a 78 aperture (black dots). Errors are within the size of the symbols. A linear least-squares fit to the three data points yields the range for the AGN slope plotted by the two steep lines. This slope is corroborated by the slope (dashed line) obtained with larger apertures 14 (Elvis) and 157 (McAlary). The range of host slopes plotted by the two shallow lines is taken from Sakata et al. (2010). The intersection area of the AGN and host slopes (red shaded) defines the host contribution. The blue shaded area marks the intersection of the AGN slope with the range of B fluxes during our Aug.–Nov. 2009 monitoring campaign. This area allows us to infer the range of V fluxes during the monitoring campaign. The vertical dotted line marks the host flux found in an aperture of via modelling of HST F550M images by Bentz et al. (2009). All data are corrected for galactic foreground extinction.
Current usage metrics show cumulative count of Article Views (full-text article views including HTML views, PDF and ePub downloads, according to the available data) and Abstracts Views on Vision4Press platform.
Data correspond to usage on the plateform after 2015. The current usage metrics is available 48-96 hours after online publication and is updated daily on week days.
Initial download of the metrics may take a while.