Fig. 11
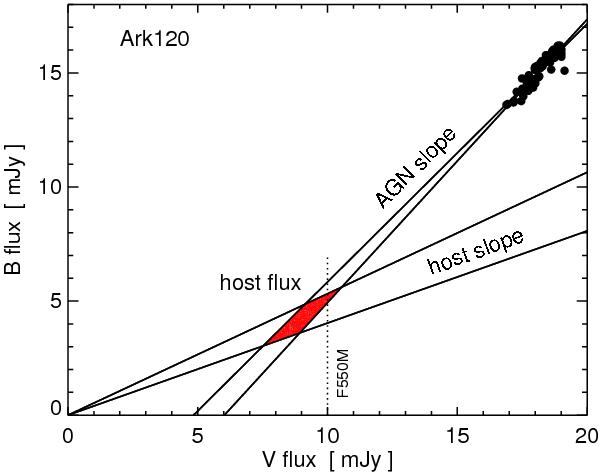
B versus V fluxes of Ark 120, measured in a 7.5 aperture. The fluxes for each night (fat dots) follow a linear gradient yielding the range for the AGN slope. As host slope we adopted the range found by Sakata et al. (2010). The intersection of the two slopes (red shaded area) defines the host flux. The vertical dotted line marks the host flux found in an aperture of via modelling of HST F550M images by Bentz et al. (2009). All data are corrected for galactic foreground extinction.
Current usage metrics show cumulative count of Article Views (full-text article views including HTML views, PDF and ePub downloads, according to the available data) and Abstracts Views on Vision4Press platform.
Data correspond to usage on the plateform after 2015. The current usage metrics is available 48-96 hours after online publication and is updated daily on week days.
Initial download of the metrics may take a while.