Free Access
Fig. 9
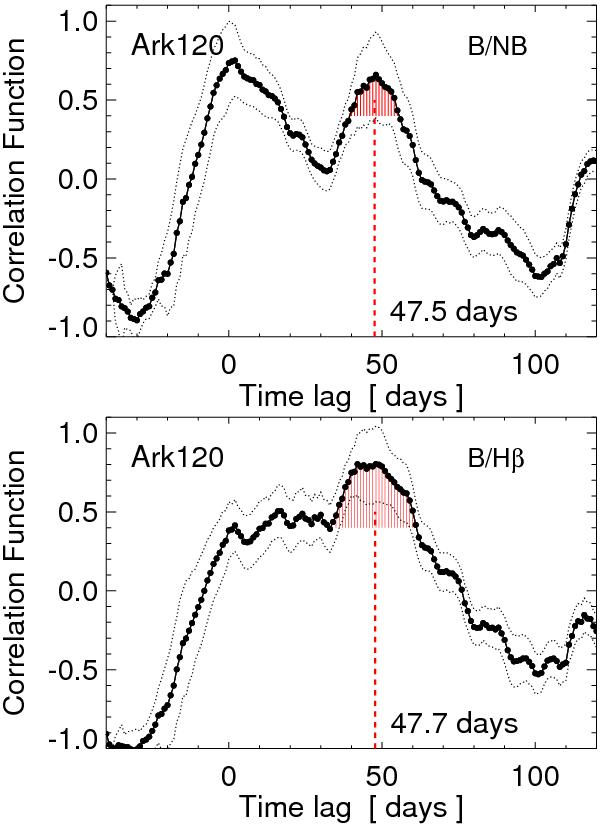
Cross correlations of Ark 120 light curves for B and NB, and for B and the synthetic Hβ (=NB − 0.5 V). The dotted lines indicate the error range ( ± 1σ) around the cross correlation. The red shaded area marks the range used to calculate the lag τcent (vertical dashed line).
This figure is made of several images, please see below:
Current usage metrics show cumulative count of Article Views (full-text article views including HTML views, PDF and ePub downloads, according to the available data) and Abstracts Views on Vision4Press platform.
Data correspond to usage on the plateform after 2015. The current usage metrics is available 48-96 hours after online publication and is updated daily on week days.
Initial download of the metrics may take a while.